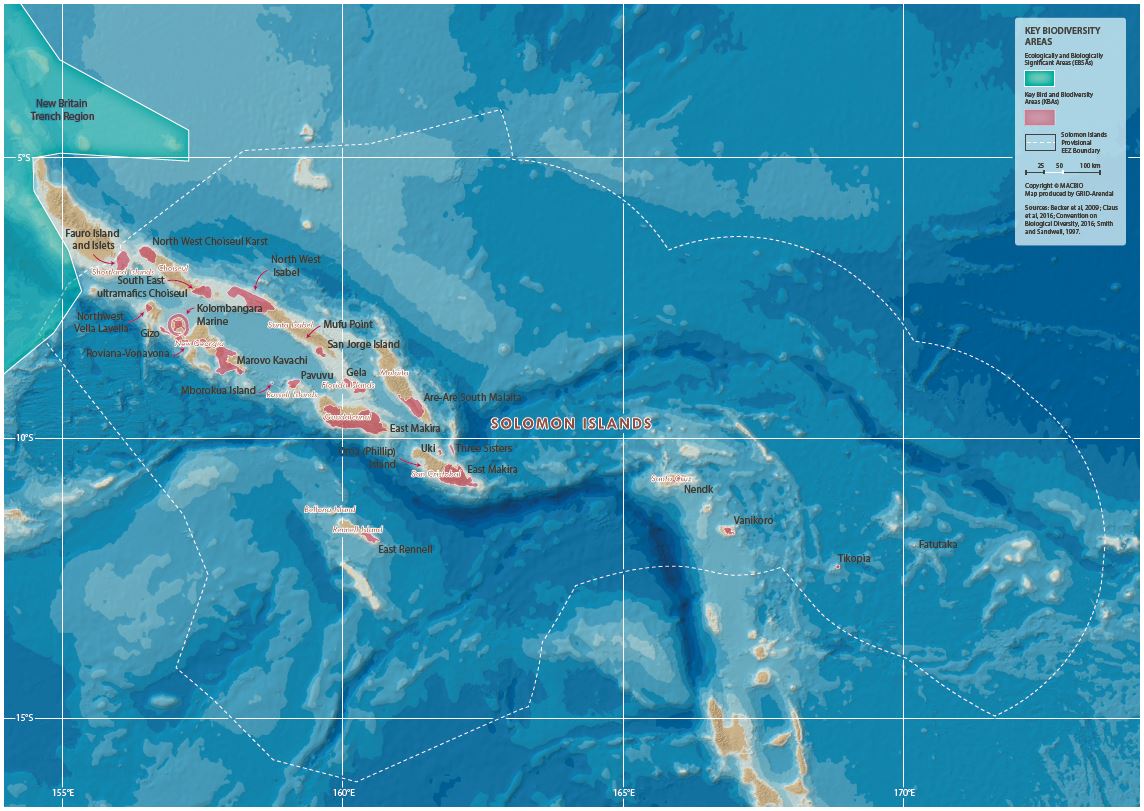
Map showing the different uses that put pressure on the marine environment. This includes among others vessel tracts, fisheries data, protected and restricted areas. Data sources are:
UNEP/CBD/EBSA/WSPAC/1/2. 2011. Compilation of Scientific Information to Describe EBSAs in the Western South Pacific Region.
KBAs: CEPF
DSM Tenements: Ministry of Lands and Survey, Solomon Islands
Shipping Routes: Solomon Islands Maritime and Ports Authority (SIPA)
Marine Managed Areas: CTAtlas
Vessel Tracks: Exact AIS
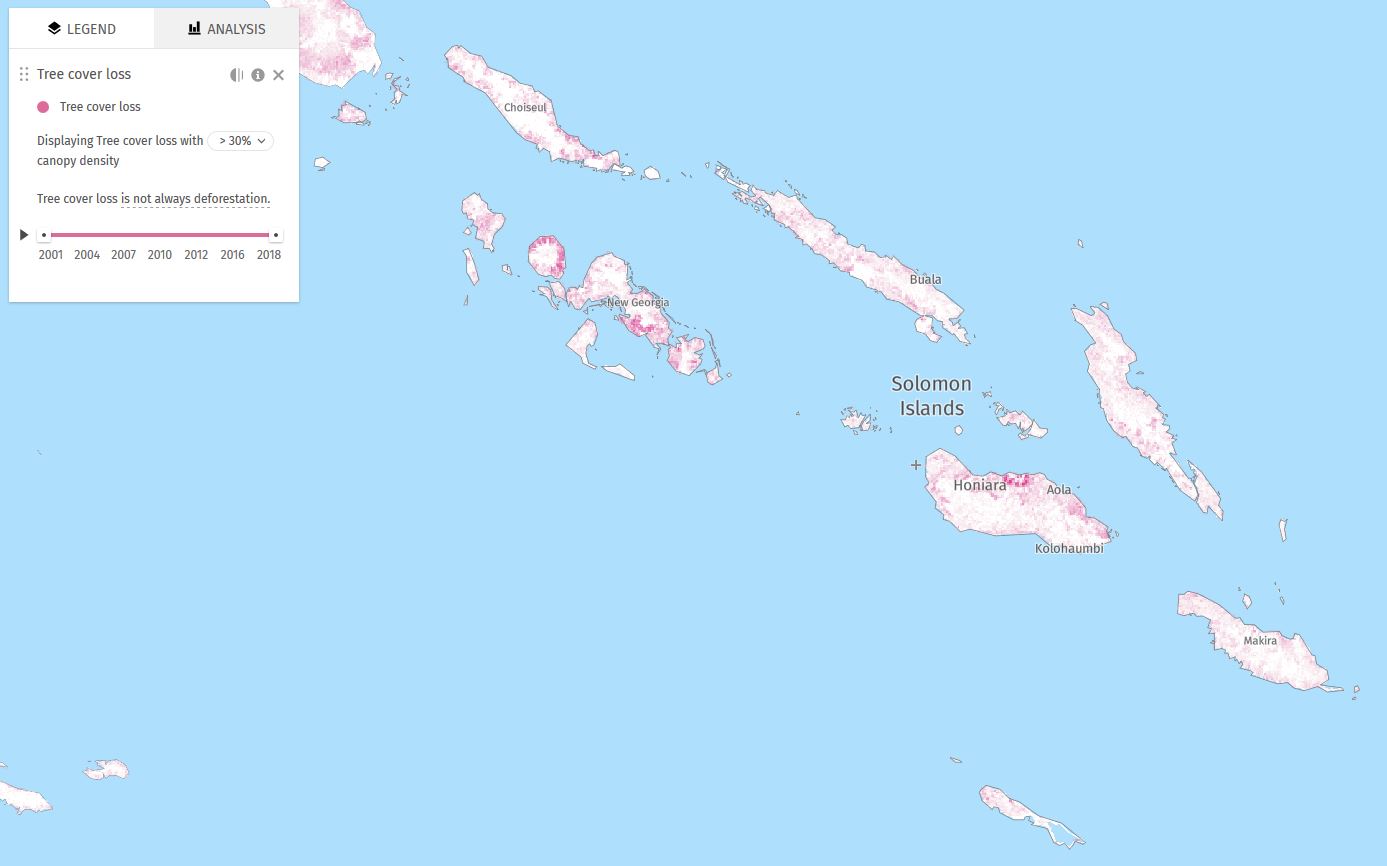
Map displaying tree cover loss with > 30% canopy density, between 2001-2018. Tree cover loss is not always deforestation. Global Forest Watch data.
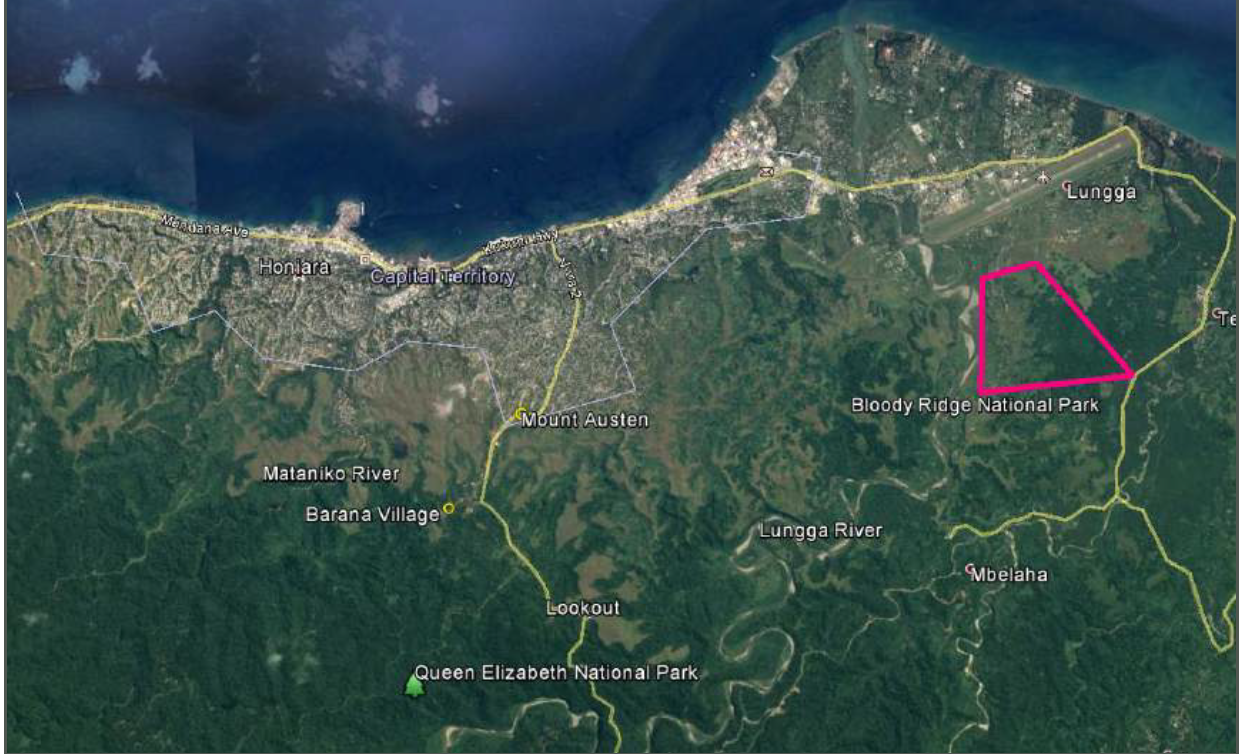
Indication of location for the establishment of the Barana and Queen Elizabeth Park to improve the upper Mataniko and Lungga catchment area’s provision of fresh water supply and other ecosystem services.
*refer to Honiara Ecosystem Based Adaptation Option Assessment report for more detailed information*
This is an example map from the Solomon Islands Marine Atlas. A series of maps from the Marine Atlas are uploaded as separate datasets to this portal. Use the search box or filter by the keyword/tag "maps".
he 33 deepwater bioregions for the Solomon Islands were condensed into 26 bioregions. The major changes were made to the northwestern side of the Solomon Islands EEZ; there was general agreement about the deepwater bioregions in the southeastern half of the country. Bioregions 120, 164, 167, 192, 244, and 304 were merged with Bioregion 222. Bioregion 226 was split into two halves, and one part of the non-contiguous Bioregion 240 (the part closer to the islands) was merged with 222.
The Institute for Marine Remote Sensing (IMaRS) at the University of South Florida (USF) was funded by the Oceanography Program of the National Aeronautics and Space Administration (NASA) to provide an exhaustive worldwide inventory of coral reefs using high-resolution satellite imagery. By using a consistent dataset of high-resolution (30 meter) multispectral Landsat 7 images acquired between 1999 and 2002, USF characterized, mapped and estimated the extent of shallow coral reef ecosystems in the main coral reef provinces (Caribbean-Atlantic, Pacific, Indo-Pacific, Red Sea).
a mapping representation of active and passive continental margins, oceanic plate boundaries and mid ocean spreading ridges
statistical records as of 2014 on the distribution of seamount. Accordingly, there are more seamounts in the Pacific Ocean than in the Atlantic, and their distribution can be described as comprising several elongate chains of seamounts superimposed on a more or less random background distribution (Craig and Sandwell)
This is a link to the website to download the UNEP-WCMC distribution of cold-water corals dataset.
This dataset shows the global distribution of cold-water corals. Occurrence records are given for 86 Families under the subclass Octocorallia (octocorals; also known as Alcyonaria) and four Orders (in Class Anthozoa): Scleractinia (reef-forming corals), Antipatharia (black corals), Zoanthidae (encrusting or button polyps), and Pennatulacea (sea pens). Occurrence records are also available for the order sub-Order Filifera (lace corals) in Class Hydrozoa.
This is a link to the website to download the UNEP-WCMC distribution of corals dataset.
This is a link to the website to download the UNEP-WCMC global patterns of above-ground biomass of mangrove forests.
This is a link to the website to download the distribution of seagrass biome dataset.
This is a MaxEnt model map of the global distribution of the seagrass biome. Species occurrence records were extracted from the Global Biodiversity Information Facility (GBIF), United Nations Environment Programme-World Conservation Monitoring Centre (UNEP-WCMC) Ocean Data Viewer and Ocean biogeographic information system (OBIS). This map shows the suitable habitats for the seagrass distribution at global scale.