Map of the protected areas for Nauru Island, Nauru with country-level summary statistics on the amount of area under protection, count for each type of protected area (terrestrial or marine), and the count of their designation.
Map of the protected areas in the Federated States of Micronesia with summary statistics on the amount of area under protection, count for each type of protected area (terrestrial or marine), and the count of their designation.
Map of the protected areas for the Chuuk region in the Federated States of Micronesia with summary statistics on the amount of area under protection, count for each type of protected area (terrestrial or marine), and the count of their designation.
Map of the protected areas for Kosrae in the Federated States of Micronesia with country-level summary statistics on the amount of area under protection, count for each type of protected area (terrestrial or marine), and the count of their designation.
Map of the protected areas for Pohnpei in the Federated States of Micronesia with country-level summary statistics on the amount of area under protection, count for each type of protected area (terrestrial or marine), and the count of their designation.
Map of the protected areas for Yap in the Federated States of Micronesia with country-level summary statistics on the amount of area under protection, count for each type of protected area (terrestrial or marine), and the count of their designation.
Map of the protected areas for Northern Islands, Cook Islands with country-level summary statistics on the amount of area under protection, count for each type of protected area (terrestrial or marine), and the count of their designation.
Map of the protected areas for Southern Islands, Cook Islands with country-level summary statistics on the amount of area under protection, count for each type of protected area (terrestrial or marine), and the count of their designation.
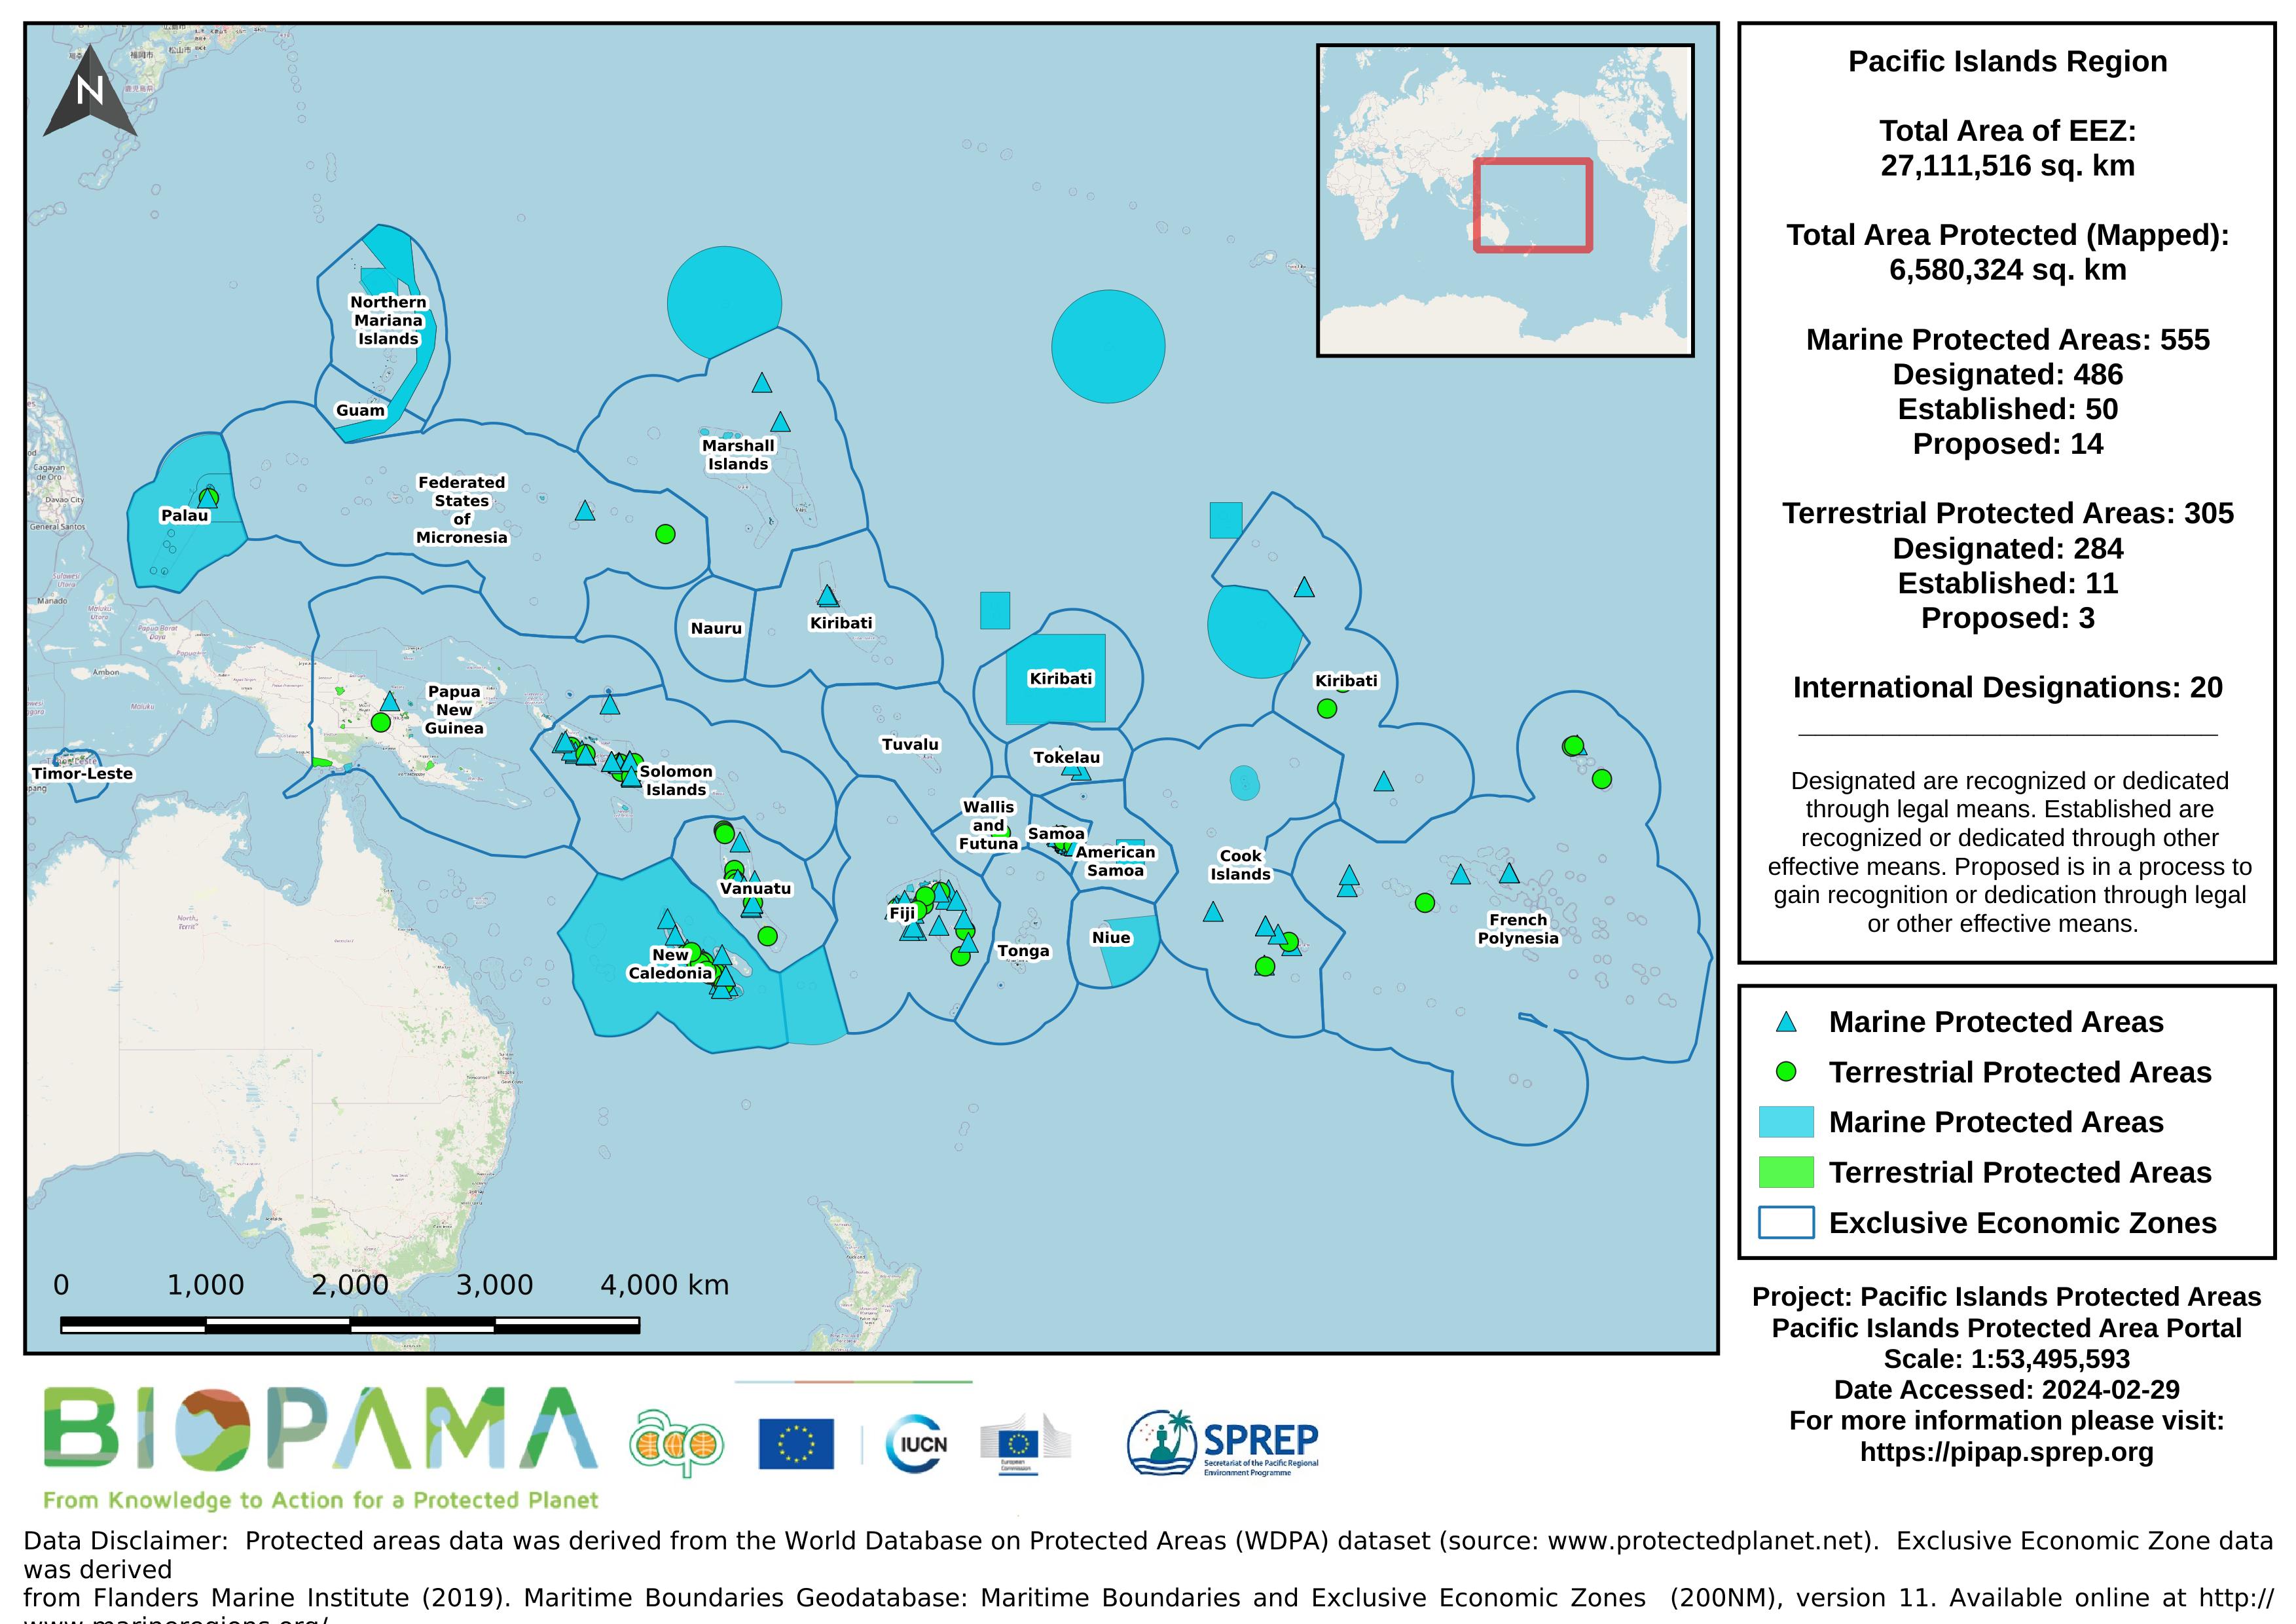
Map of the protected areas for the Pacific Islands Region with regional-level summary statistics on the amount of area under protection, count for each type of protected area (terrestrial or marine), and the count of their designation.
The maps highlights areas with significant shift in the shoreline by overlaying shoreline data from Nov 2021 and January 2022
The maps highlights areas with significant shift in the shoreline by overlaying shoreline data from Nov 2021 and January 2022
This is a test for upload invasive species document
This is the final report prepared by the Secretariat of the Pacific Regional Environment Programme (SPREP) for submission to the United Nations Development Programme (UNDP) and the Papua New Guinea Conservation and Environment Protection Authority (CEPA) in relation to the 2016–17 assessment of the management effectiveness of Papua New Guinea’s protected areas.
PNG's forest cover loss 2000-2017 downloaded from [www.globalforestwatch.org](https://www.globalforestwatch.org/)
From 2001 to 2017, Papua New Guinea lost 1.28Mha of tree cover, equivalent to a 3.0% decrease since 2000, and 158Mt of CO₂ of emissions.
Overall progress in management effectiveness for protected areas in PNG (refer to page 10)
Rarotonga Water intakes and Streams
steams and water intakes rarotonga 2014 or older