Table of Hydrofluorocarbon consumption by the Marshall Islands reported to the United Nations Environment Programme Ozone Secretariat from 1986 -2019. Source: https://ozone.unep.org/countries/profile/mhl
Annual Greenhouse Gas Emissions estimated by the Global Carbon Project 2020 for the Marshall Islands 1992-2019. Source: https://www.globalcarbonproject.org/
The data sheets used for the collection process were an adaptation of data sheets created for the International Coastal Cleanup Day by the Ocean Conservancy.
This dataset contains economic information for catch and catch vessels in the Asia and Pacific region, including country-level data on Solomon Islands.
Spreadsheet and graph derived from table 1 of Kingdom of Tonga National Plan of Action (NPOA) Shark-Plan (2014-216)
Time series data and graph of Tonga's deepwater fishery total catch 2006-2016.
Map of the protected areas for Kosrae in the Federated States of Micronesia with country-level summary statistics on the amount of area under protection, count for each type of protected area (terrestrial or marine), and the count of their designation.
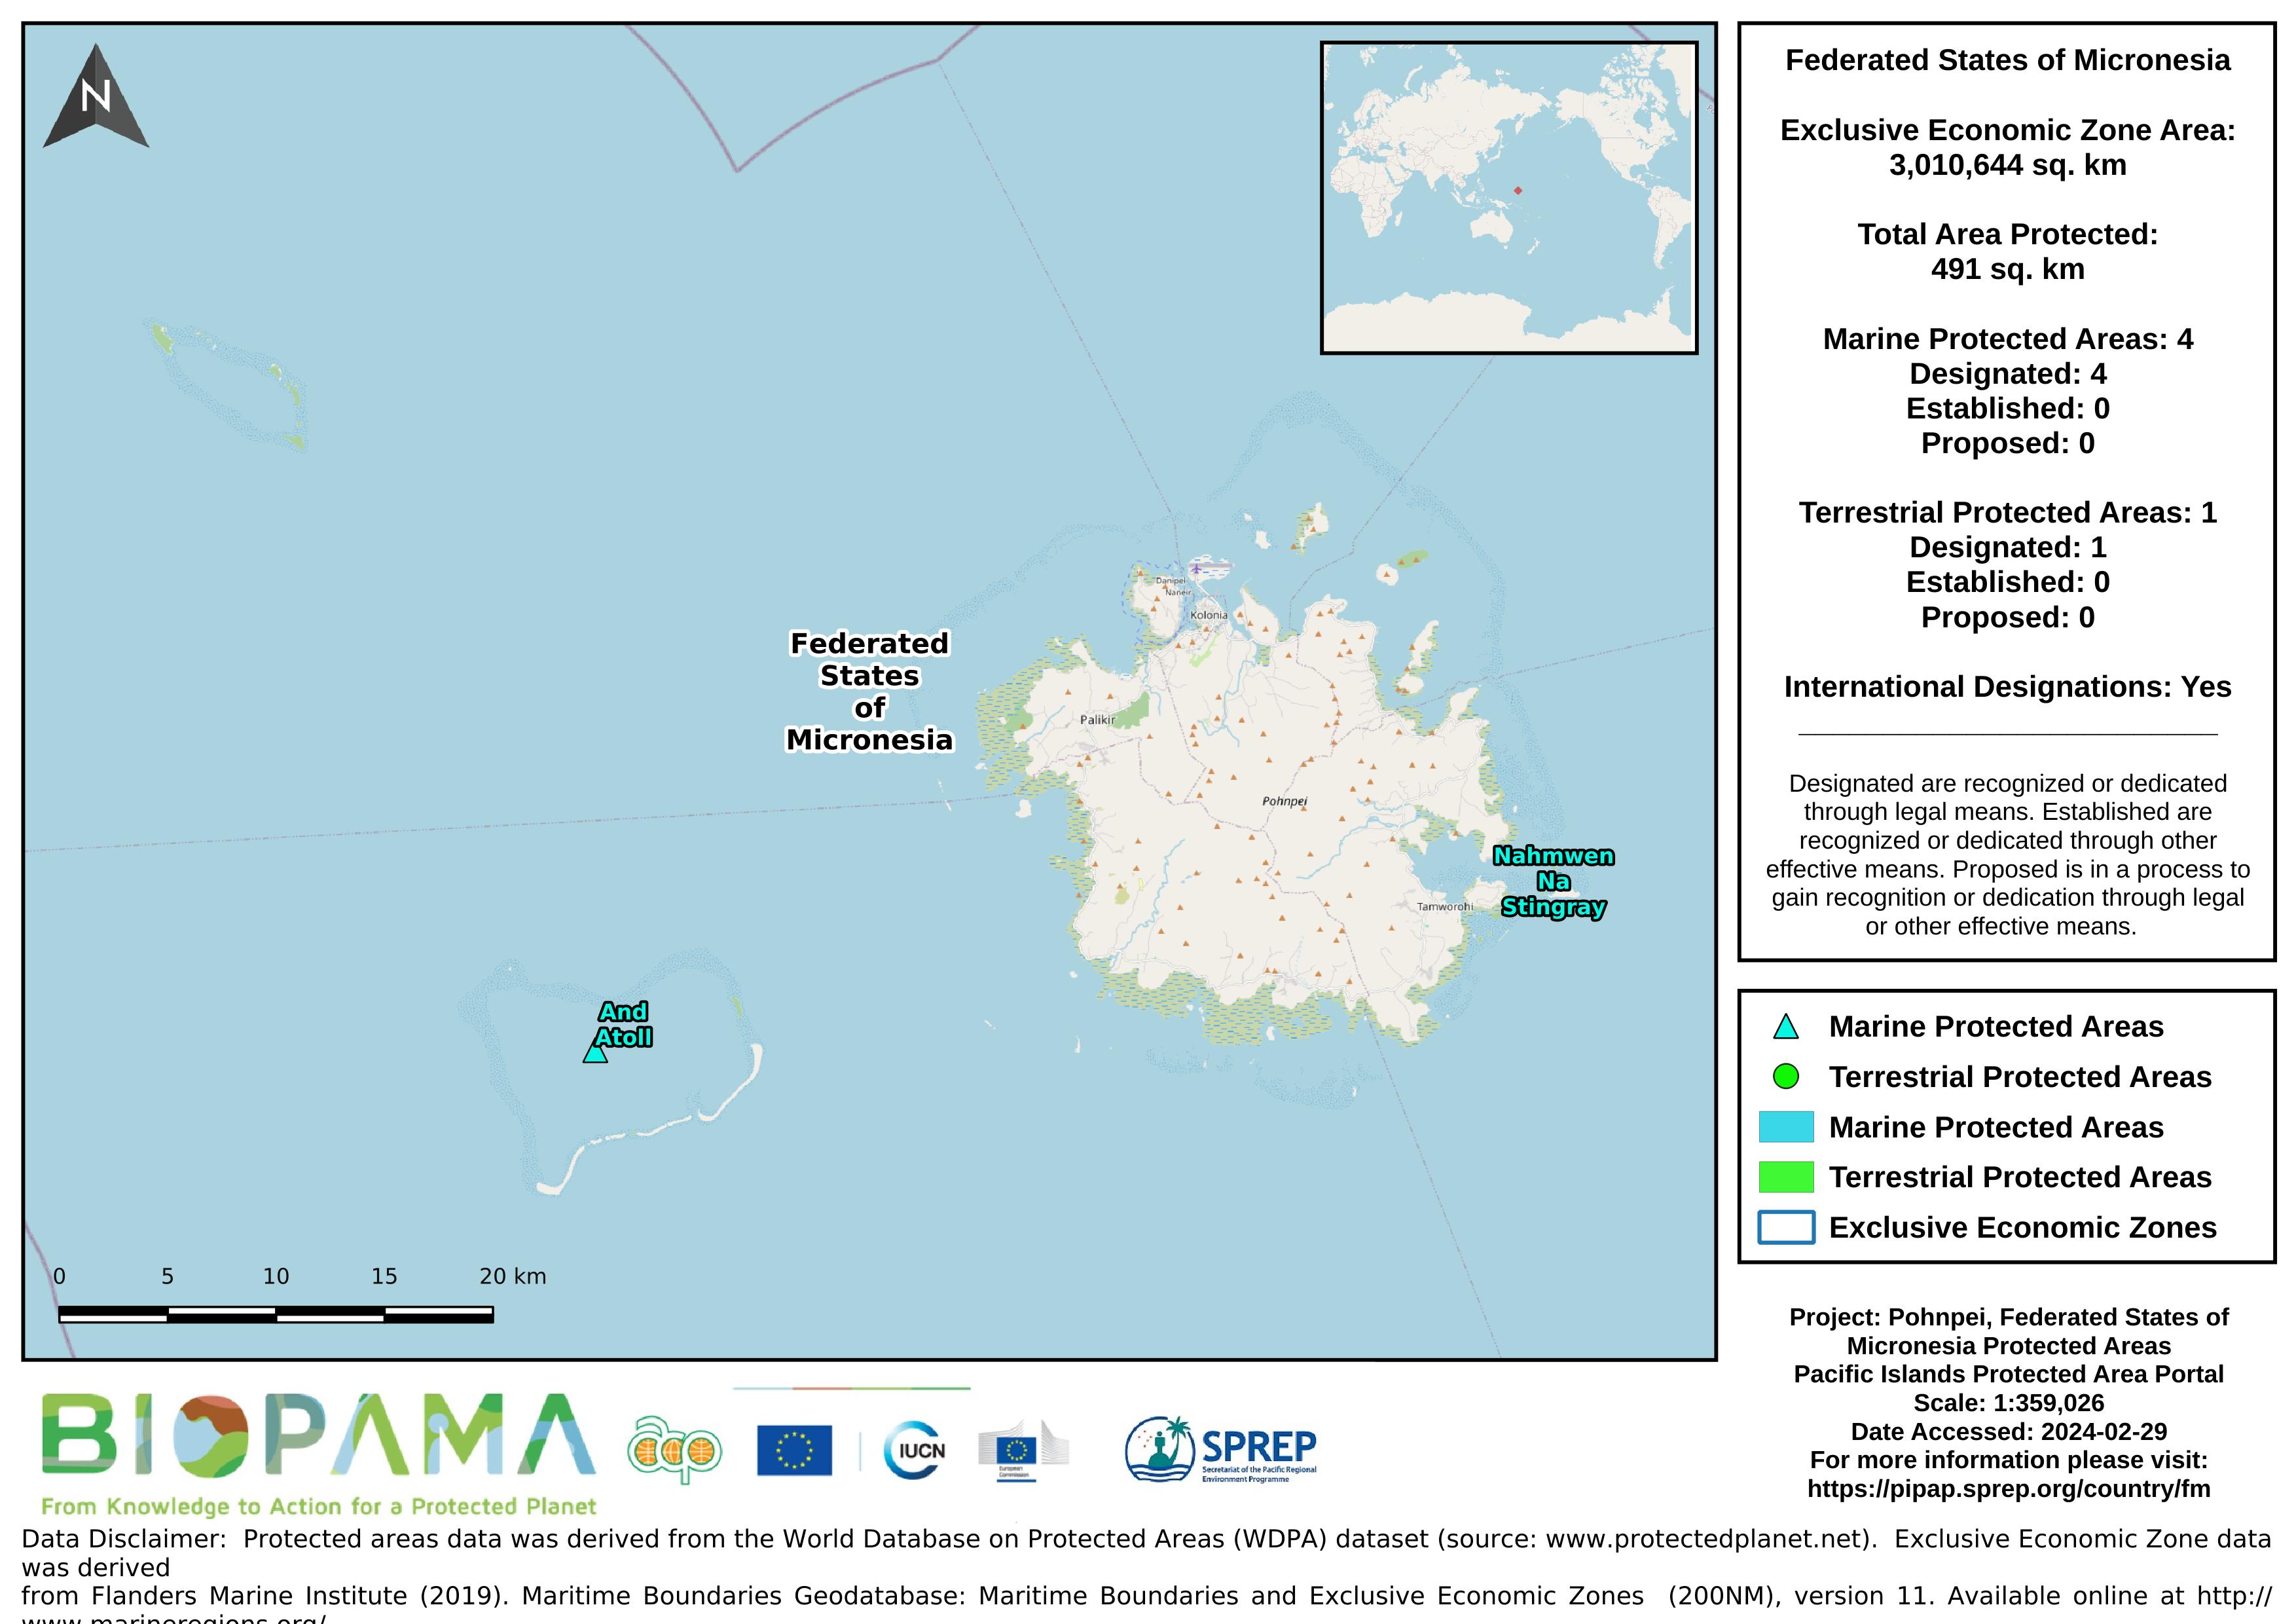
Map of the protected areas for Pohnpei in the Federated States of Micronesia with country-level summary statistics on the amount of area under protection, count for each type of protected area (terrestrial or marine), and the count of their designation.
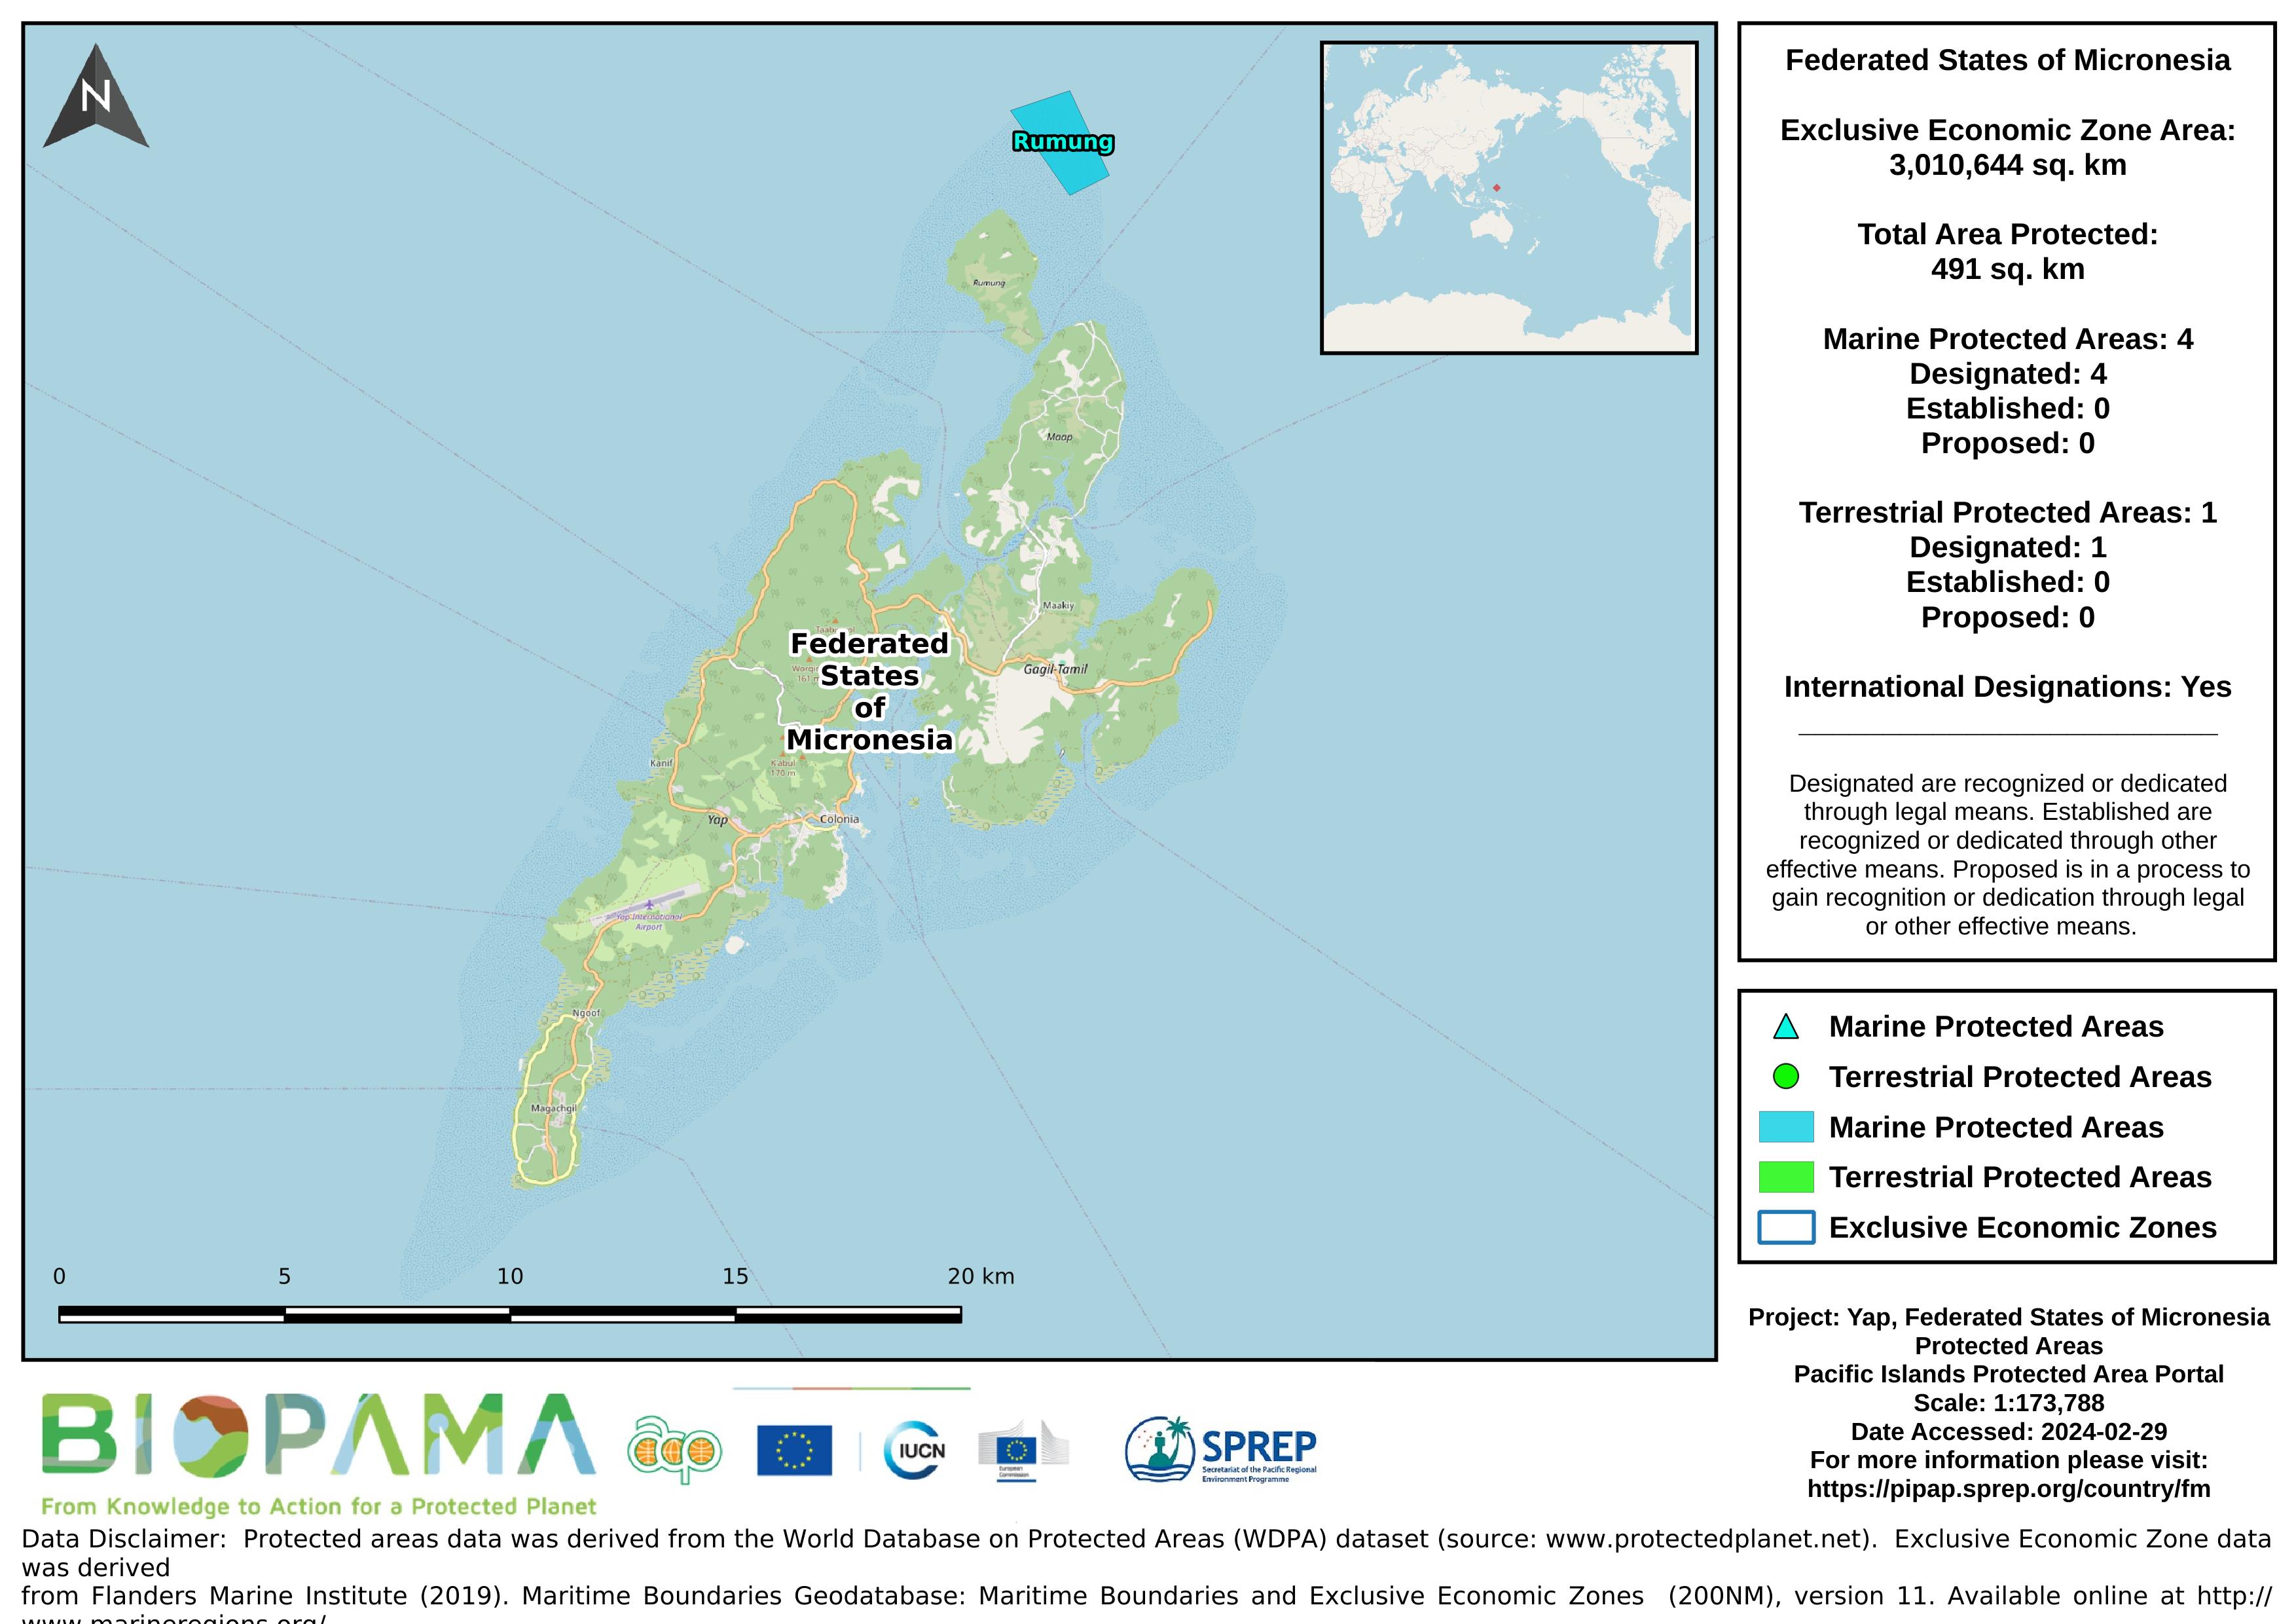
Map of the protected areas for Yap in the Federated States of Micronesia with country-level summary statistics on the amount of area under protection, count for each type of protected area (terrestrial or marine), and the count of their designation.
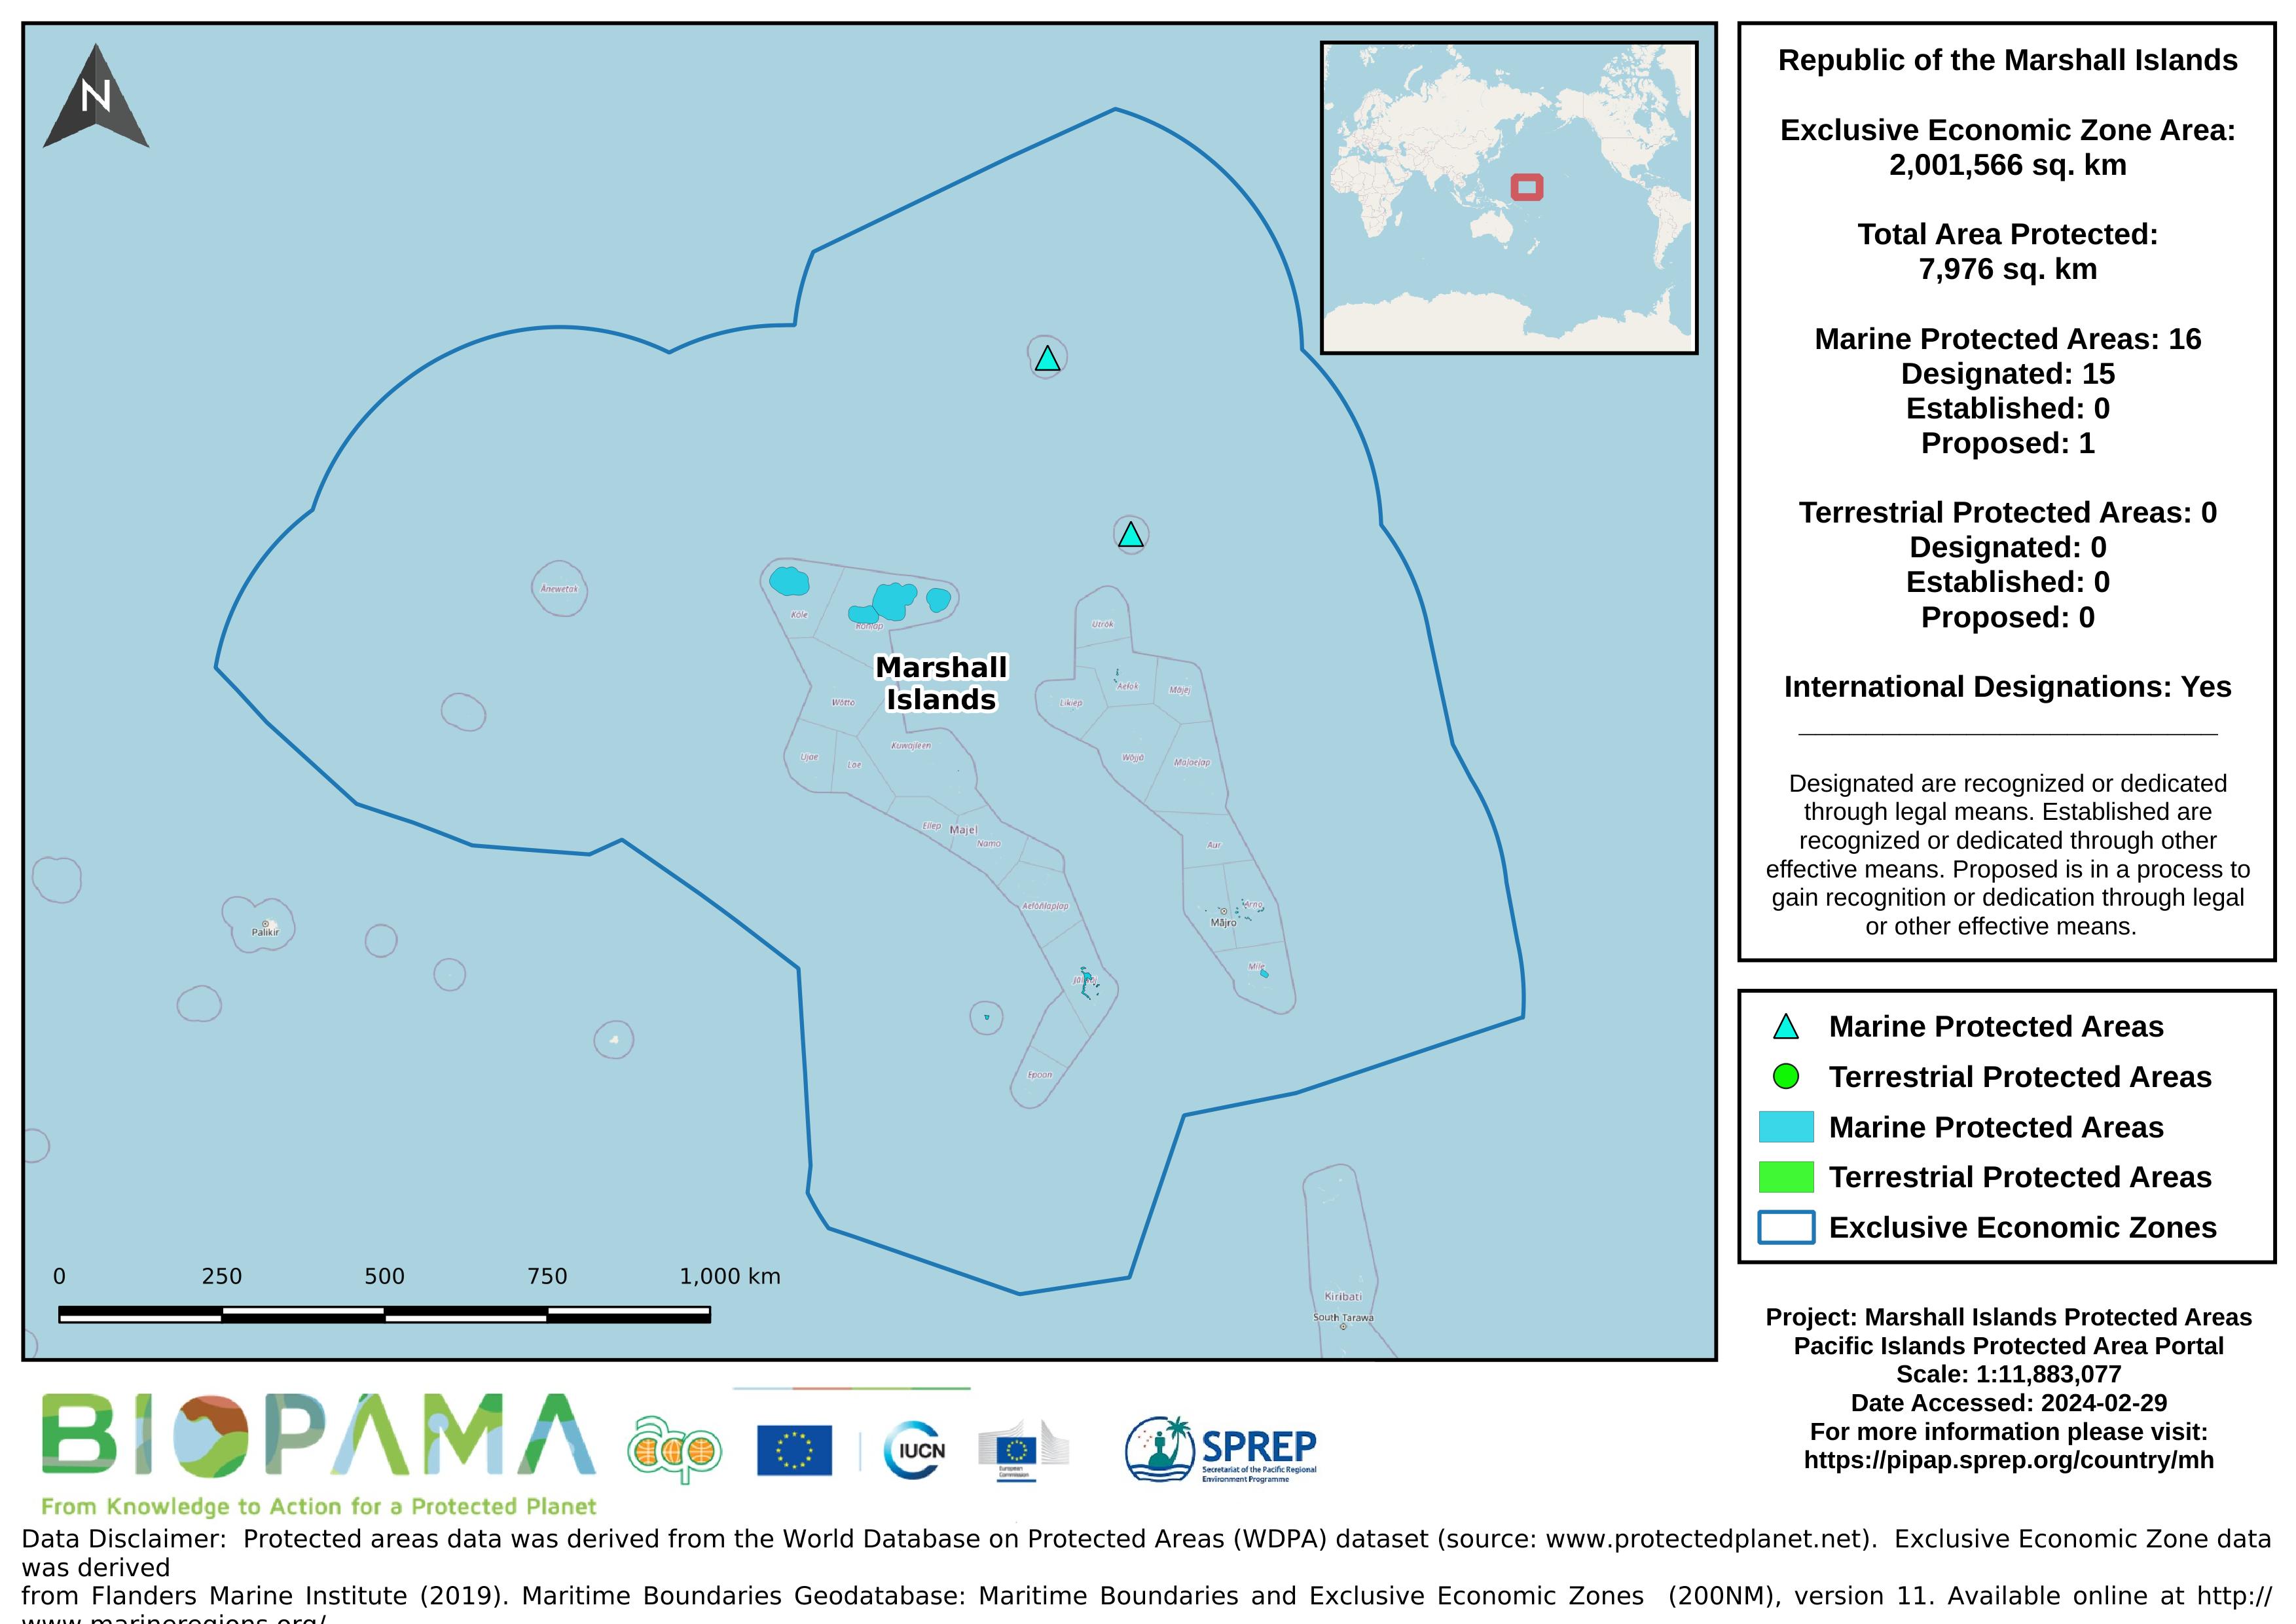
Map of the protected areas for Marshall Islands with country-level summary statistics on the amount of area under protection, count for each type of protected area (terrestrial or marine), and the count of their designation.
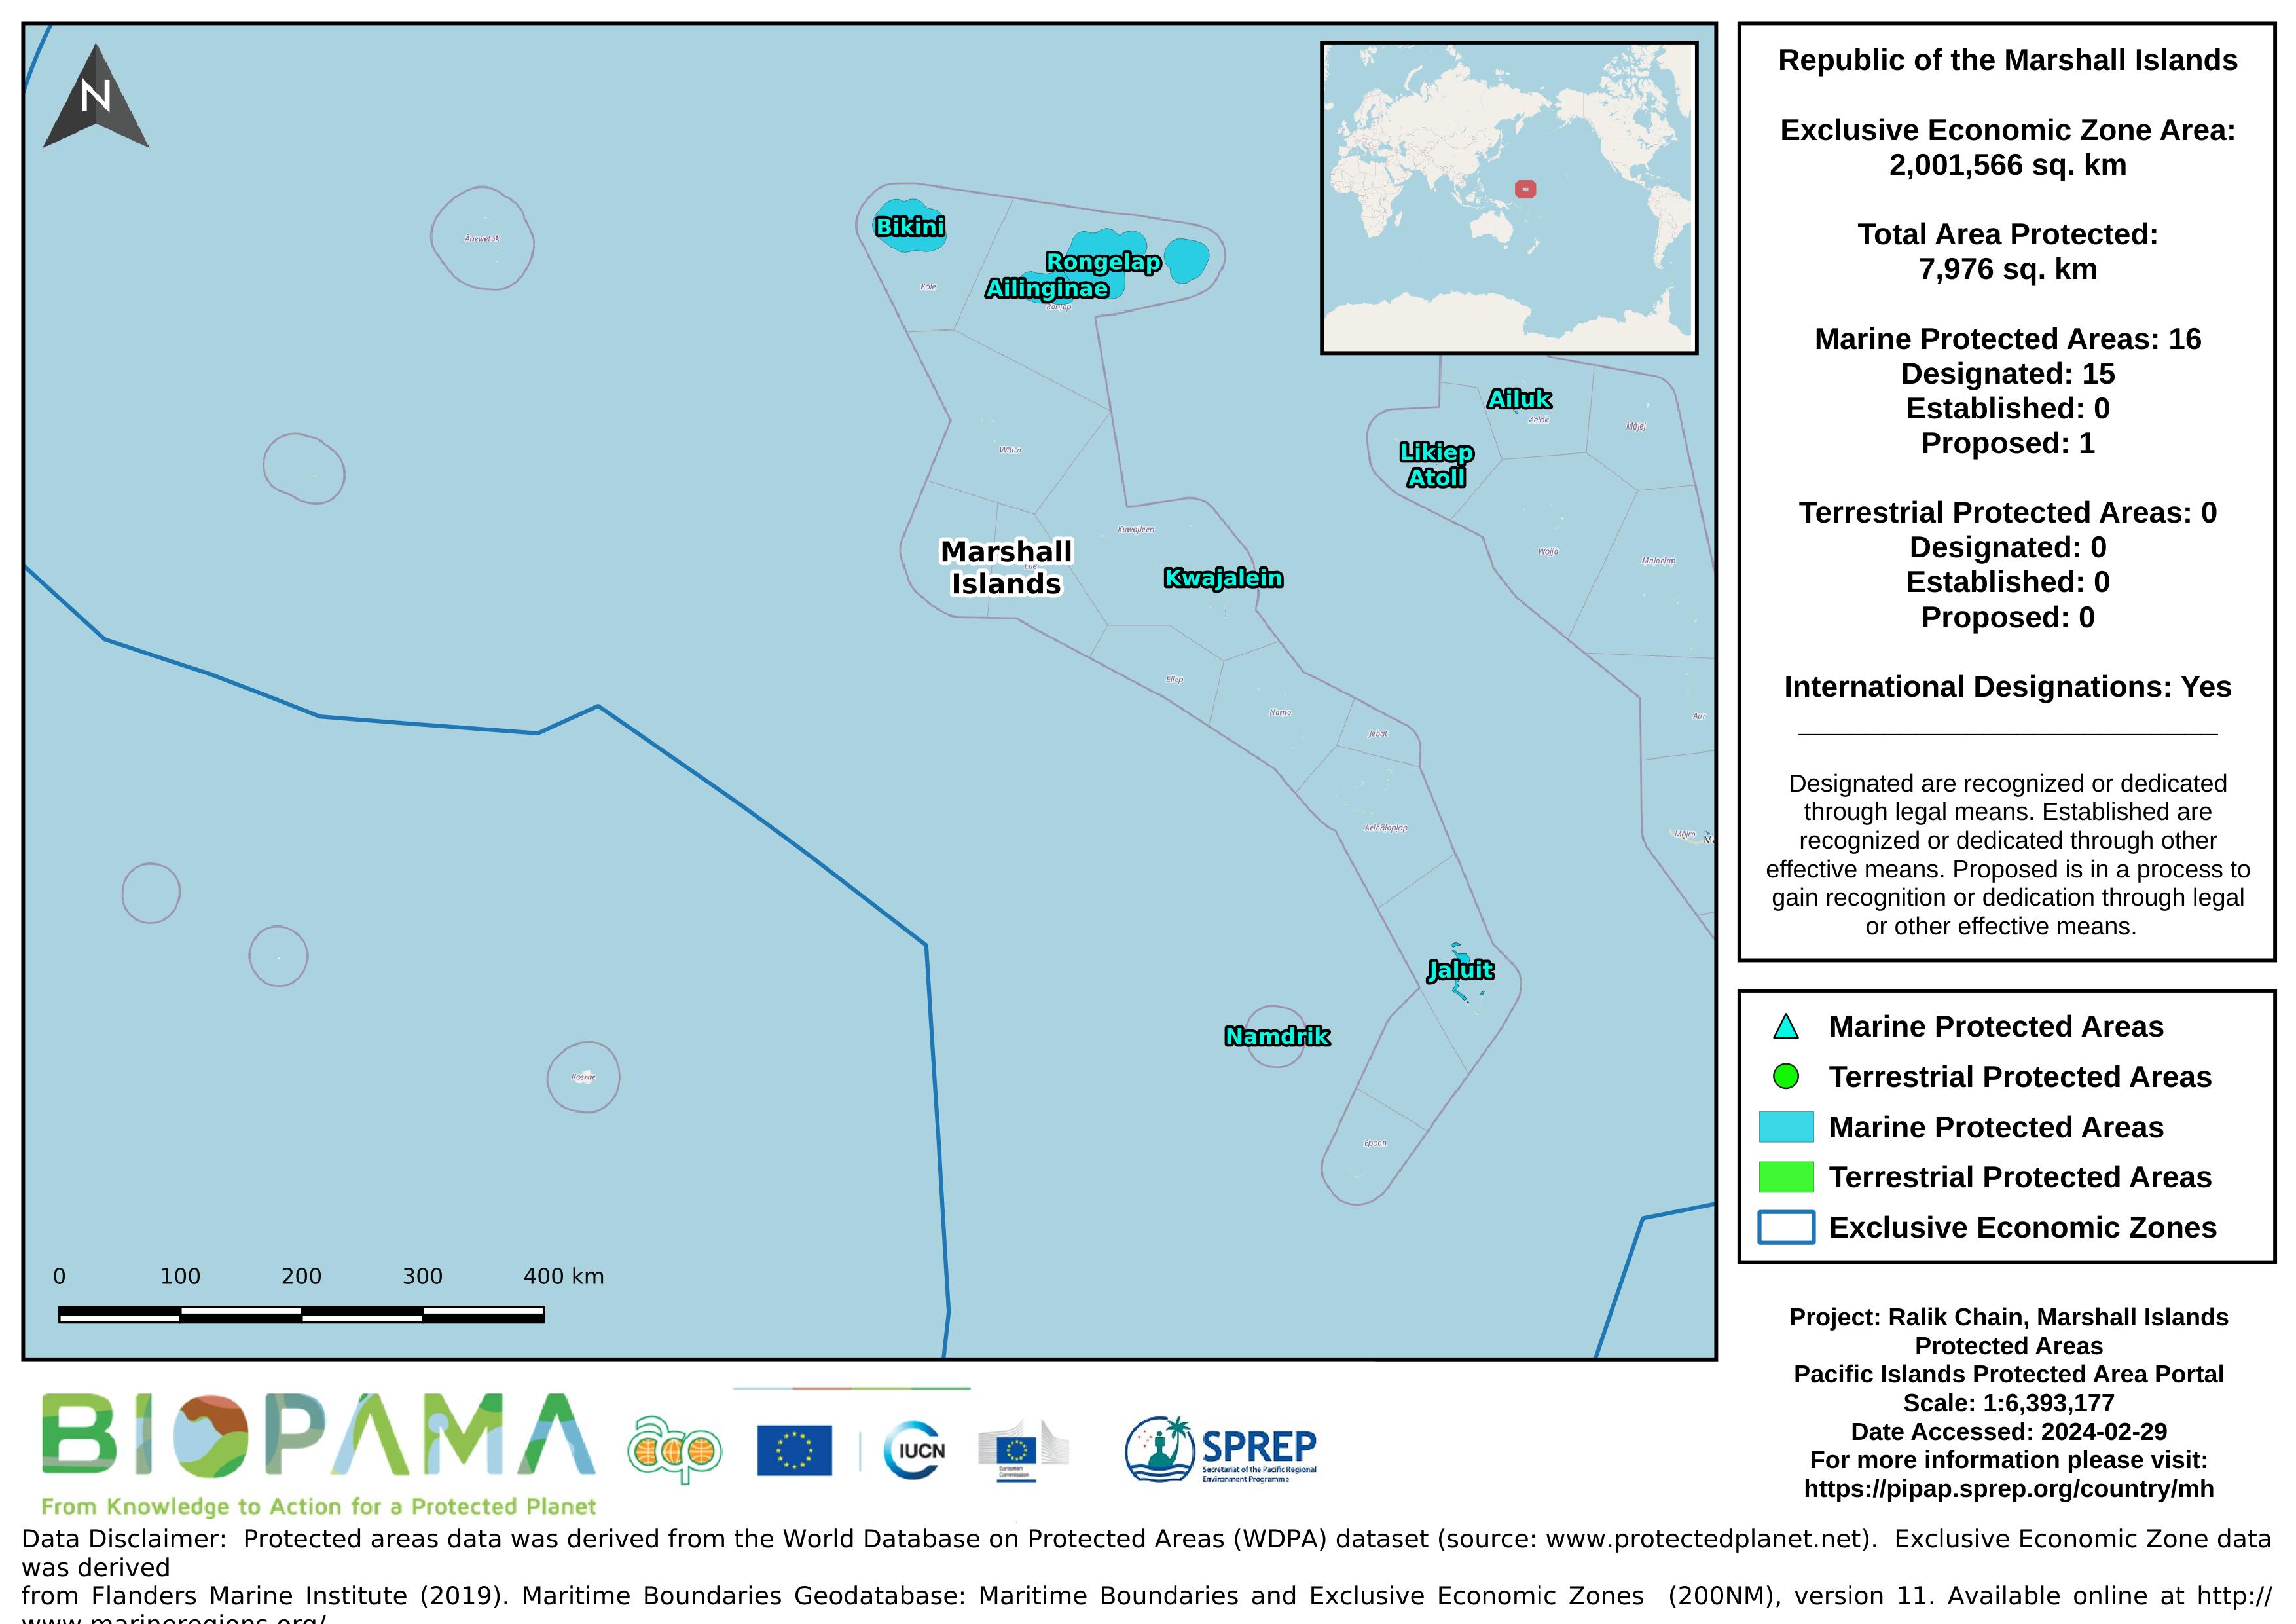
Map of the protected areas for the Ralik Chain, Marshall Islands with country-level summary statistics on the amount of area under protection, count for each type of protected area (terrestrial or marine), and the count of their designation.
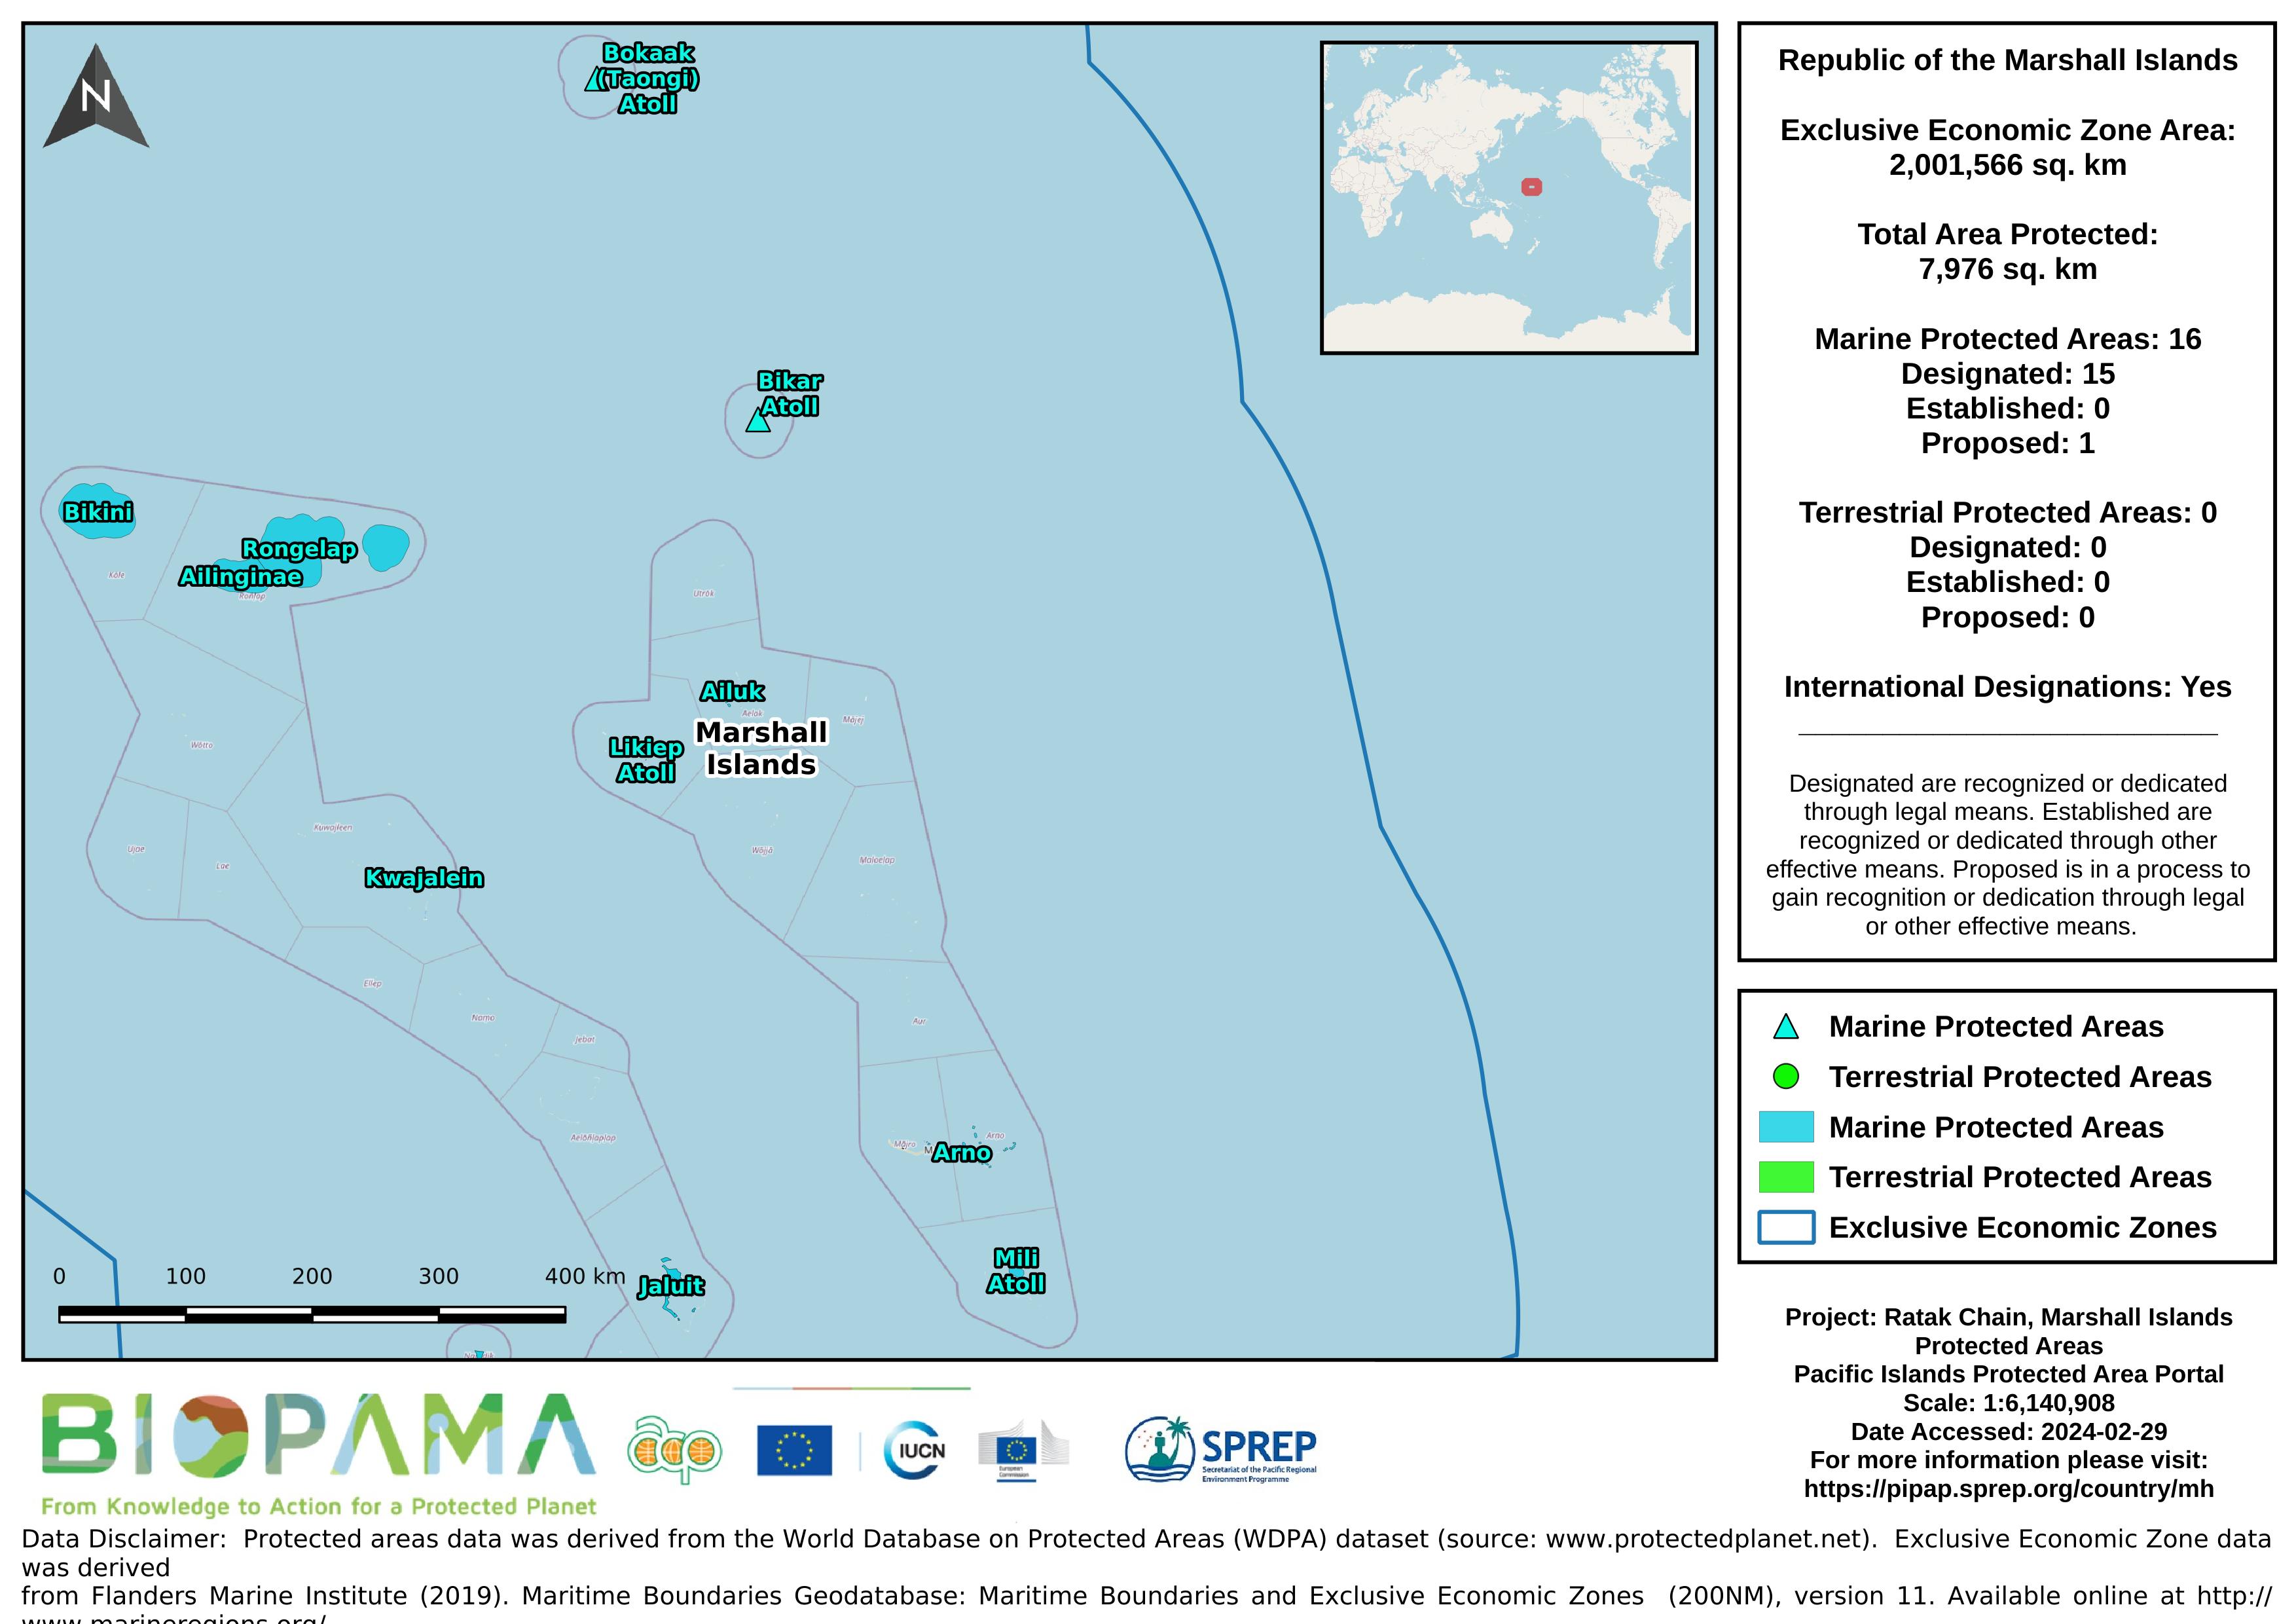
Map of the protected areas for the Ratak Chain, Marshall Islands with country-level summary statistics on the amount of area under protection, count for each type of protected area (terrestrial or marine), and the count of their designation.
Map of the protected areas for Papua New Guinea with country-level summary statistics on the amount of area under protection, count for each type of protected area (terrestrial or marine), and the count of their designation.
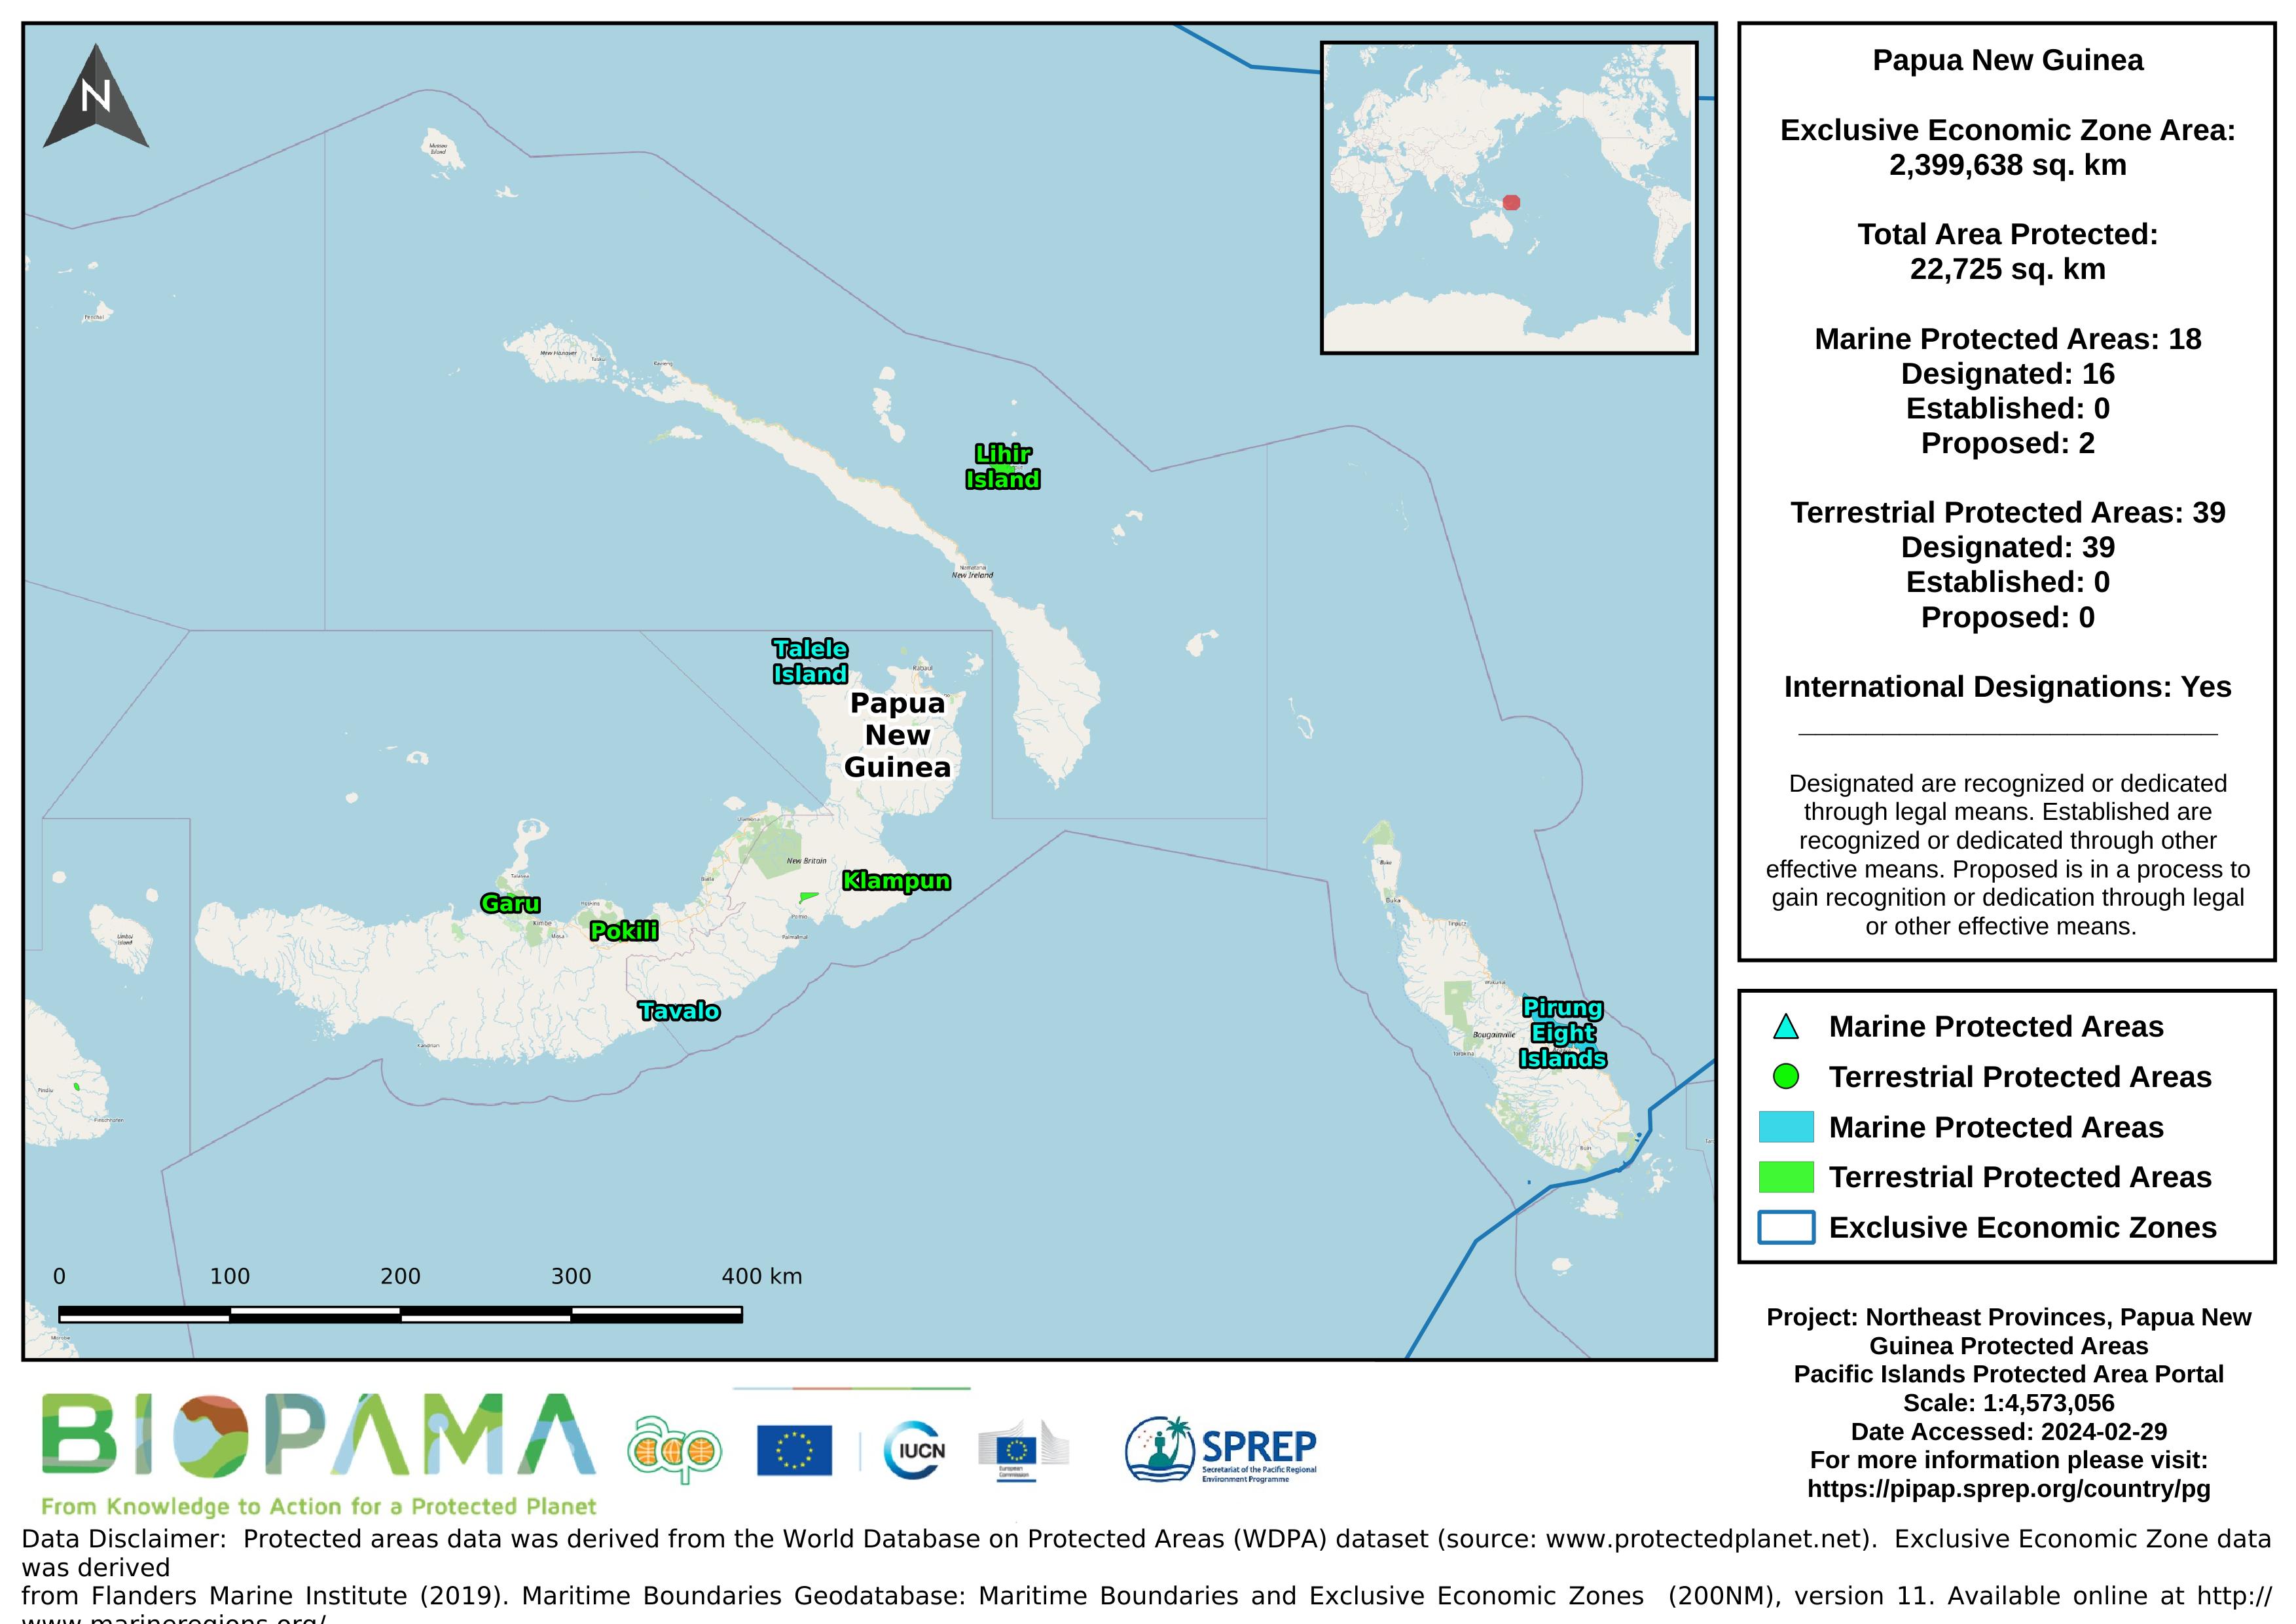
Map of the protected areas for the northeast provinces of Papua New Guinea with country-level summary statistics on the amount of area under protection, count for each type of protected area (terrestrial or marine), and the count of their designation.
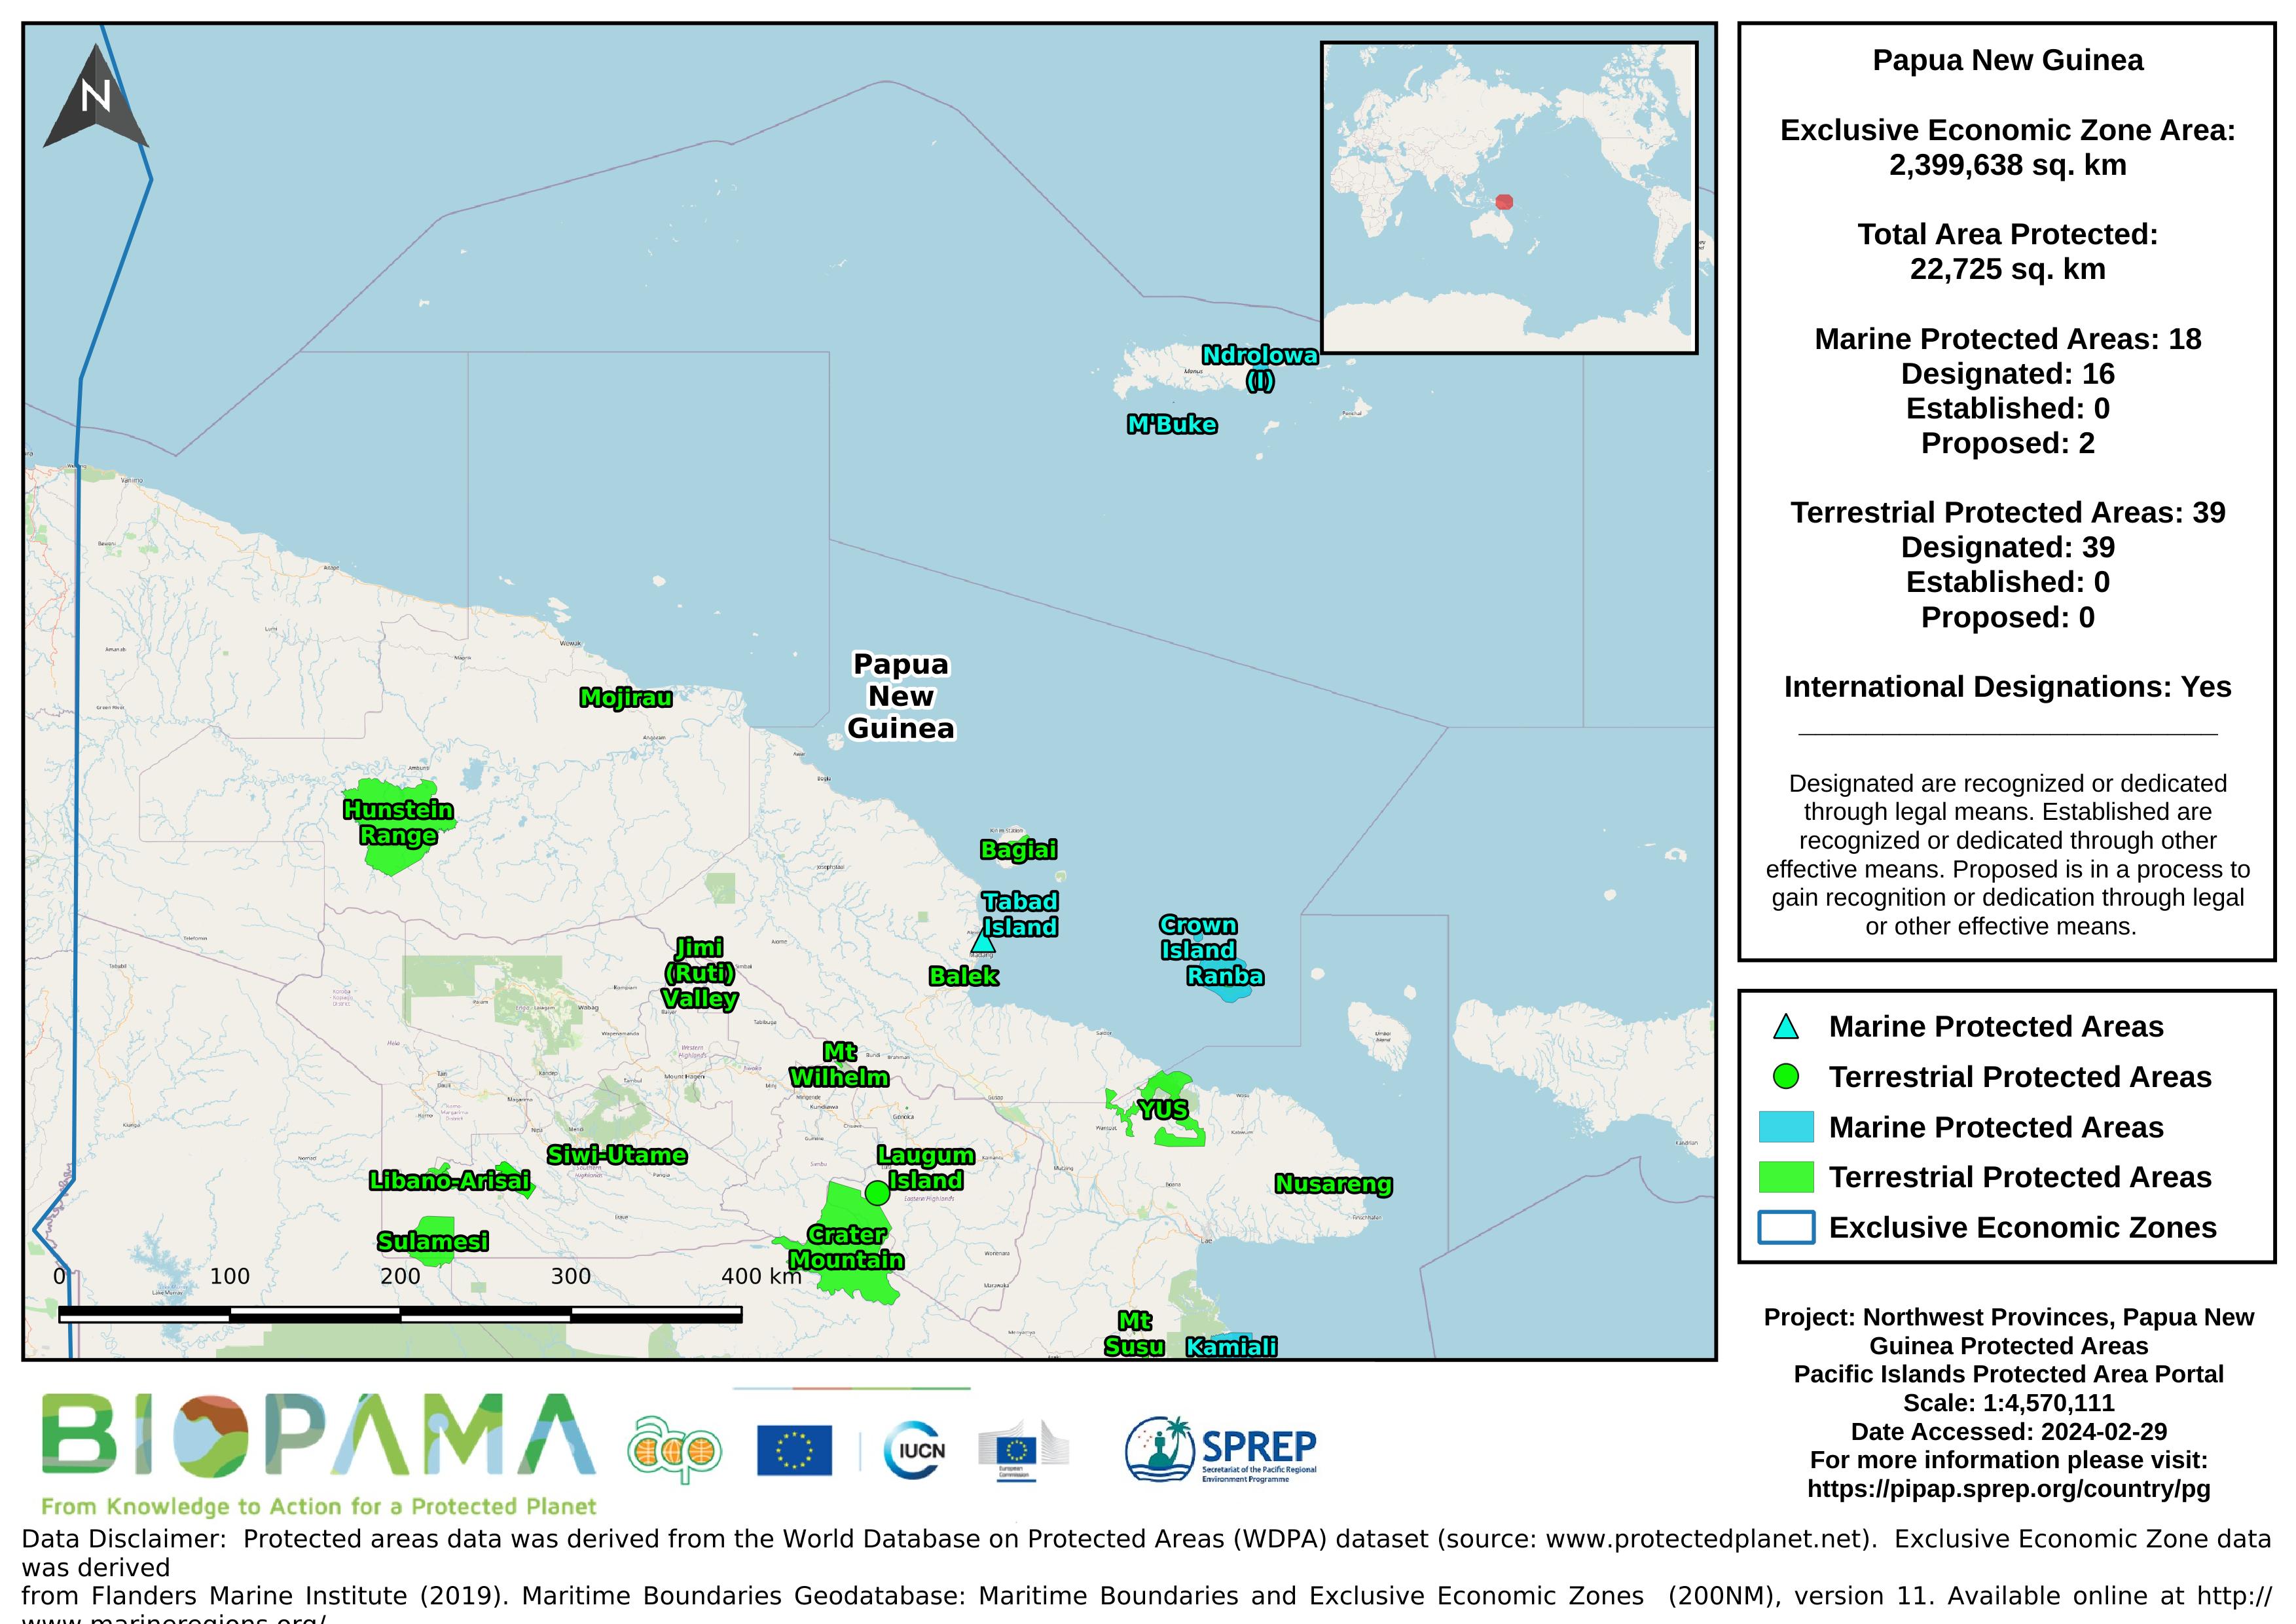
Map of the protected areas for the northwest provinces of Papua New Guinea with country-level summary statistics on the amount of area under protection, count for each type of protected area (terrestrial or marine), and the count of their designation.
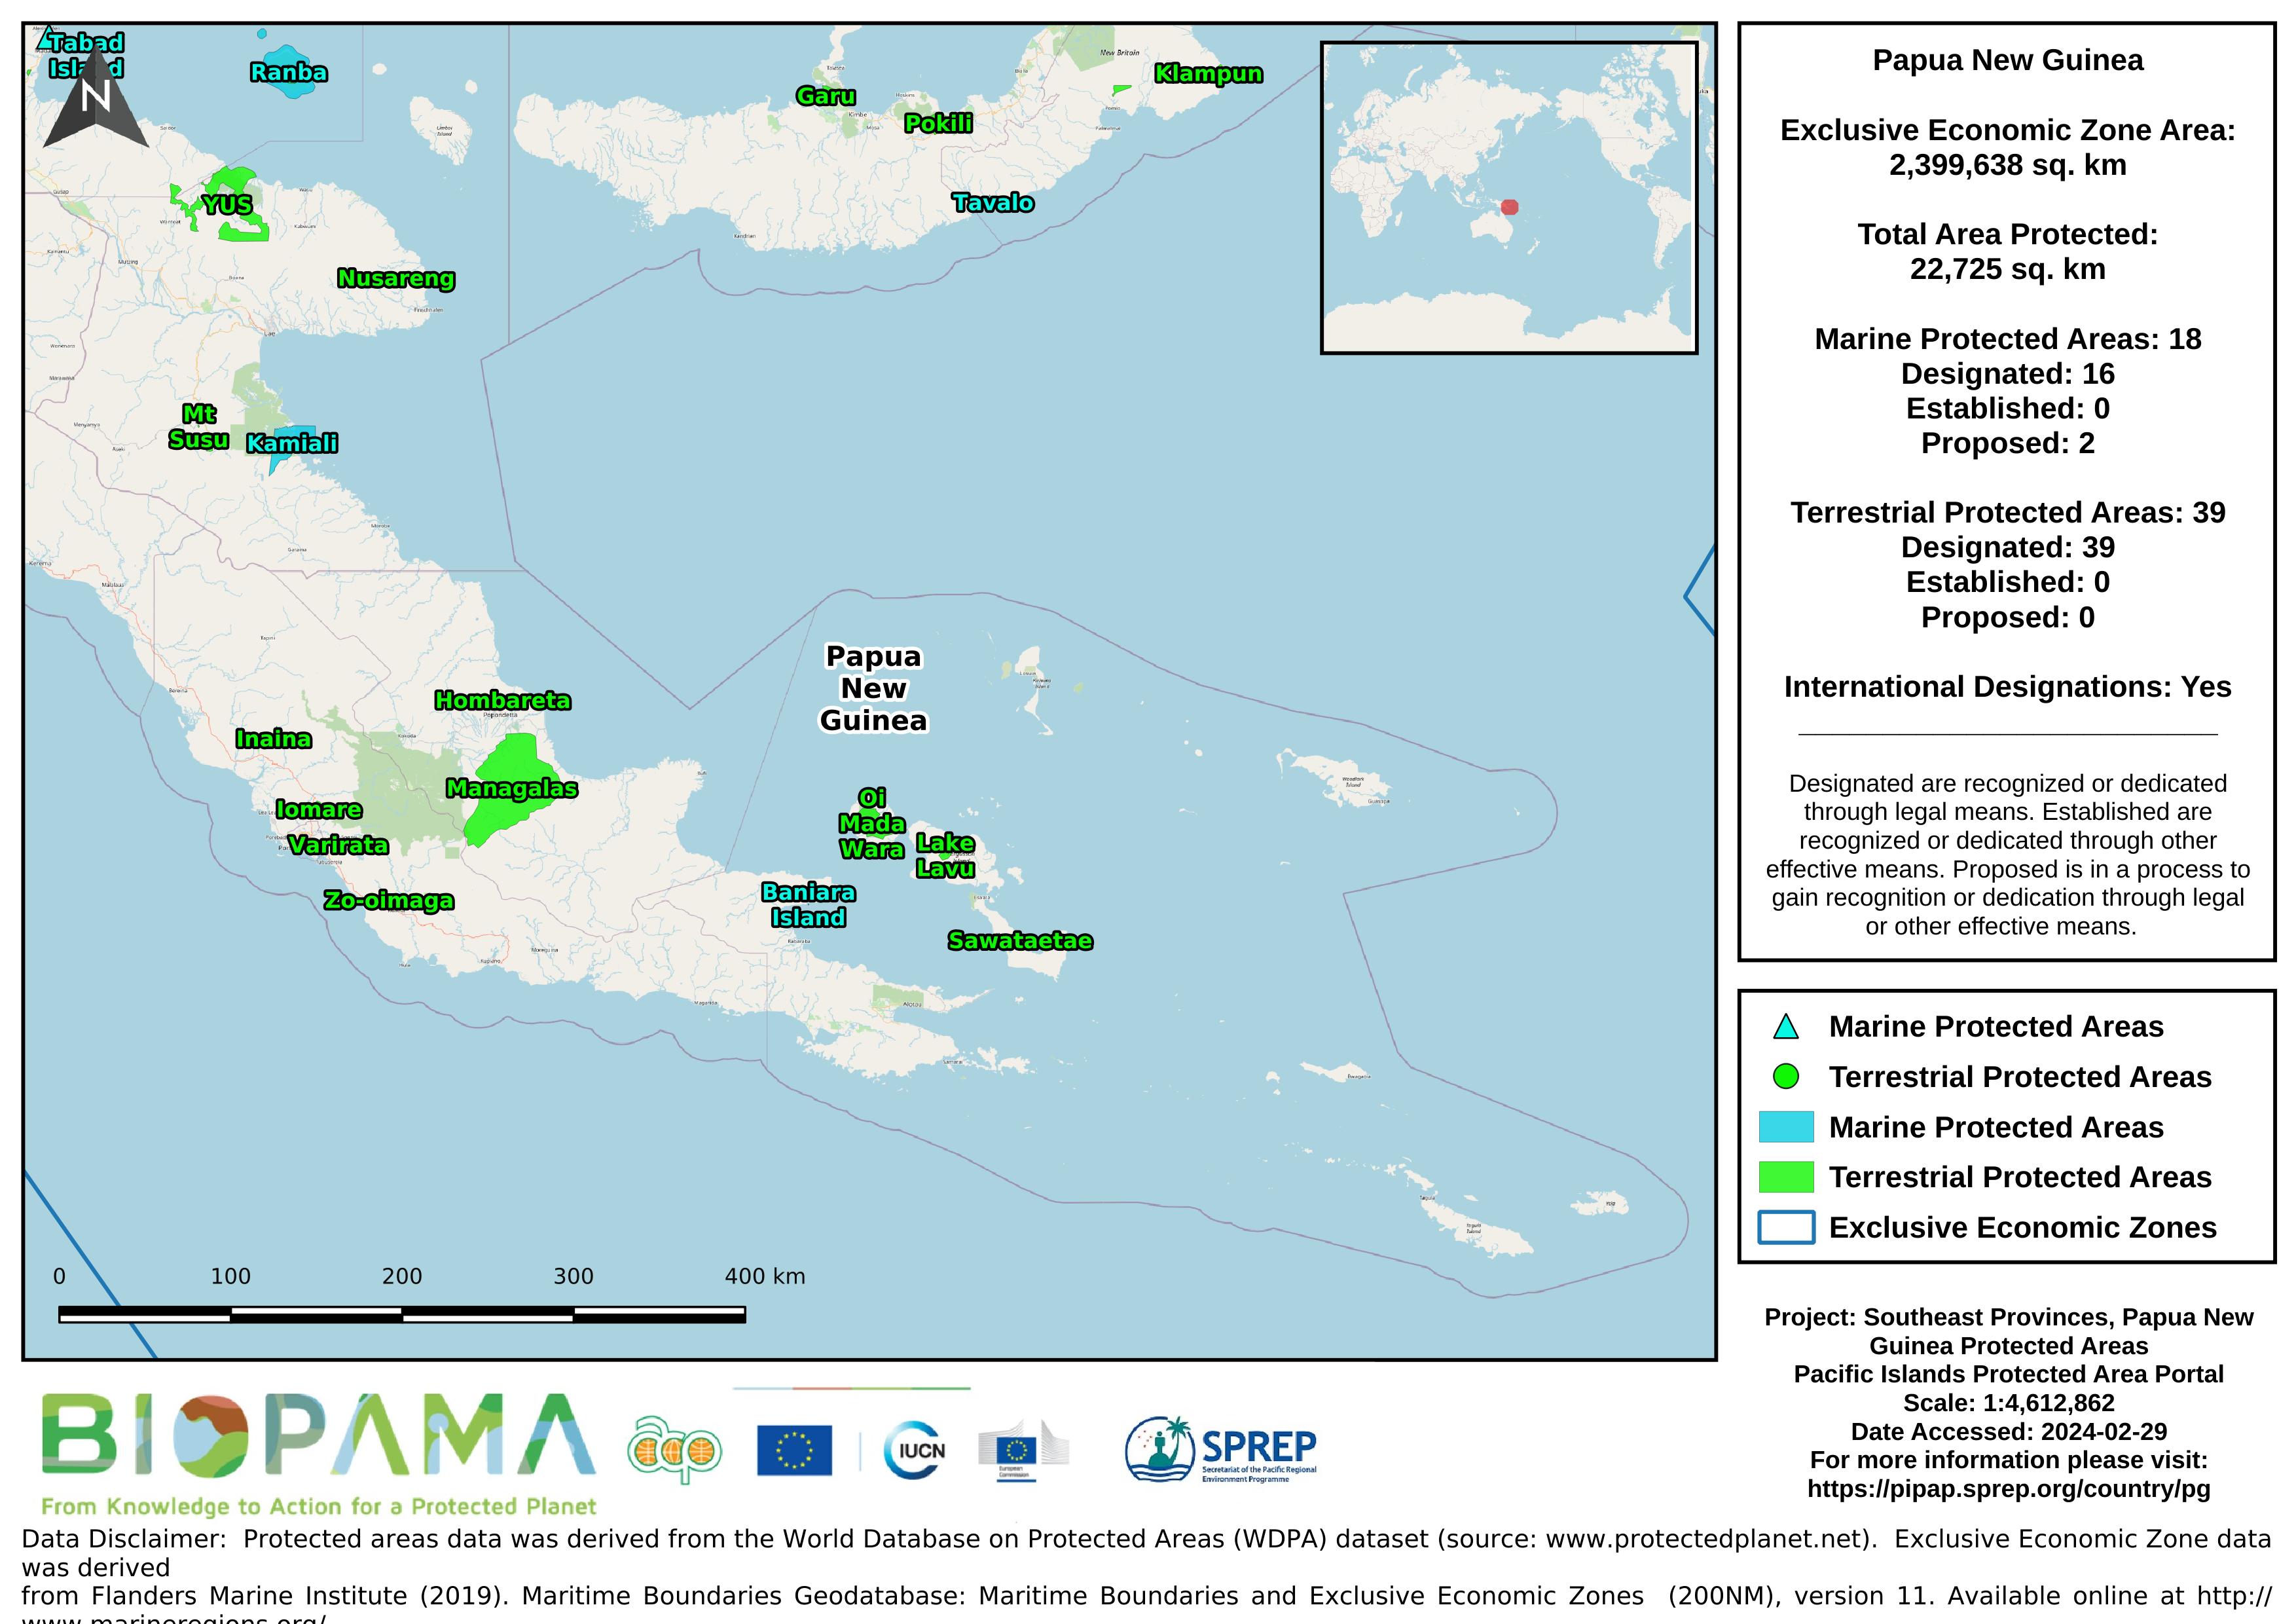
Map of the protected areas for the southeast provinces of Papua New Guinea with country-level summary statistics on the amount of area under protection, count for each type of protected area (terrestrial or marine), and the count of their designation.