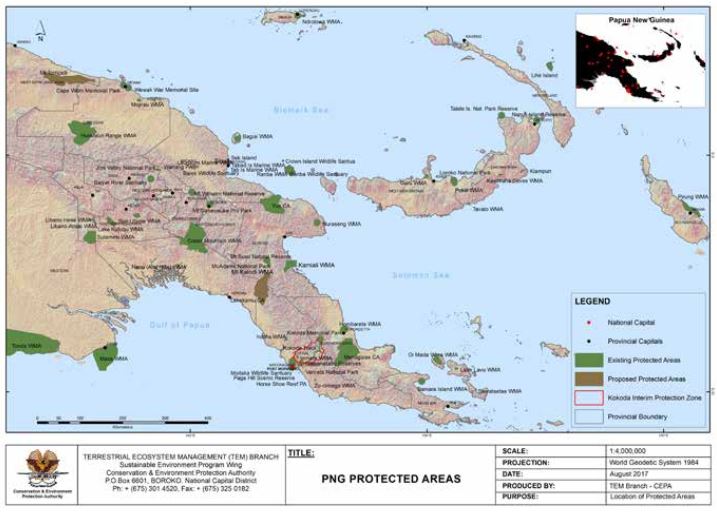
Map with existing and proposed protected areas in PNG. Status on August 2017. Produced by CEPA.
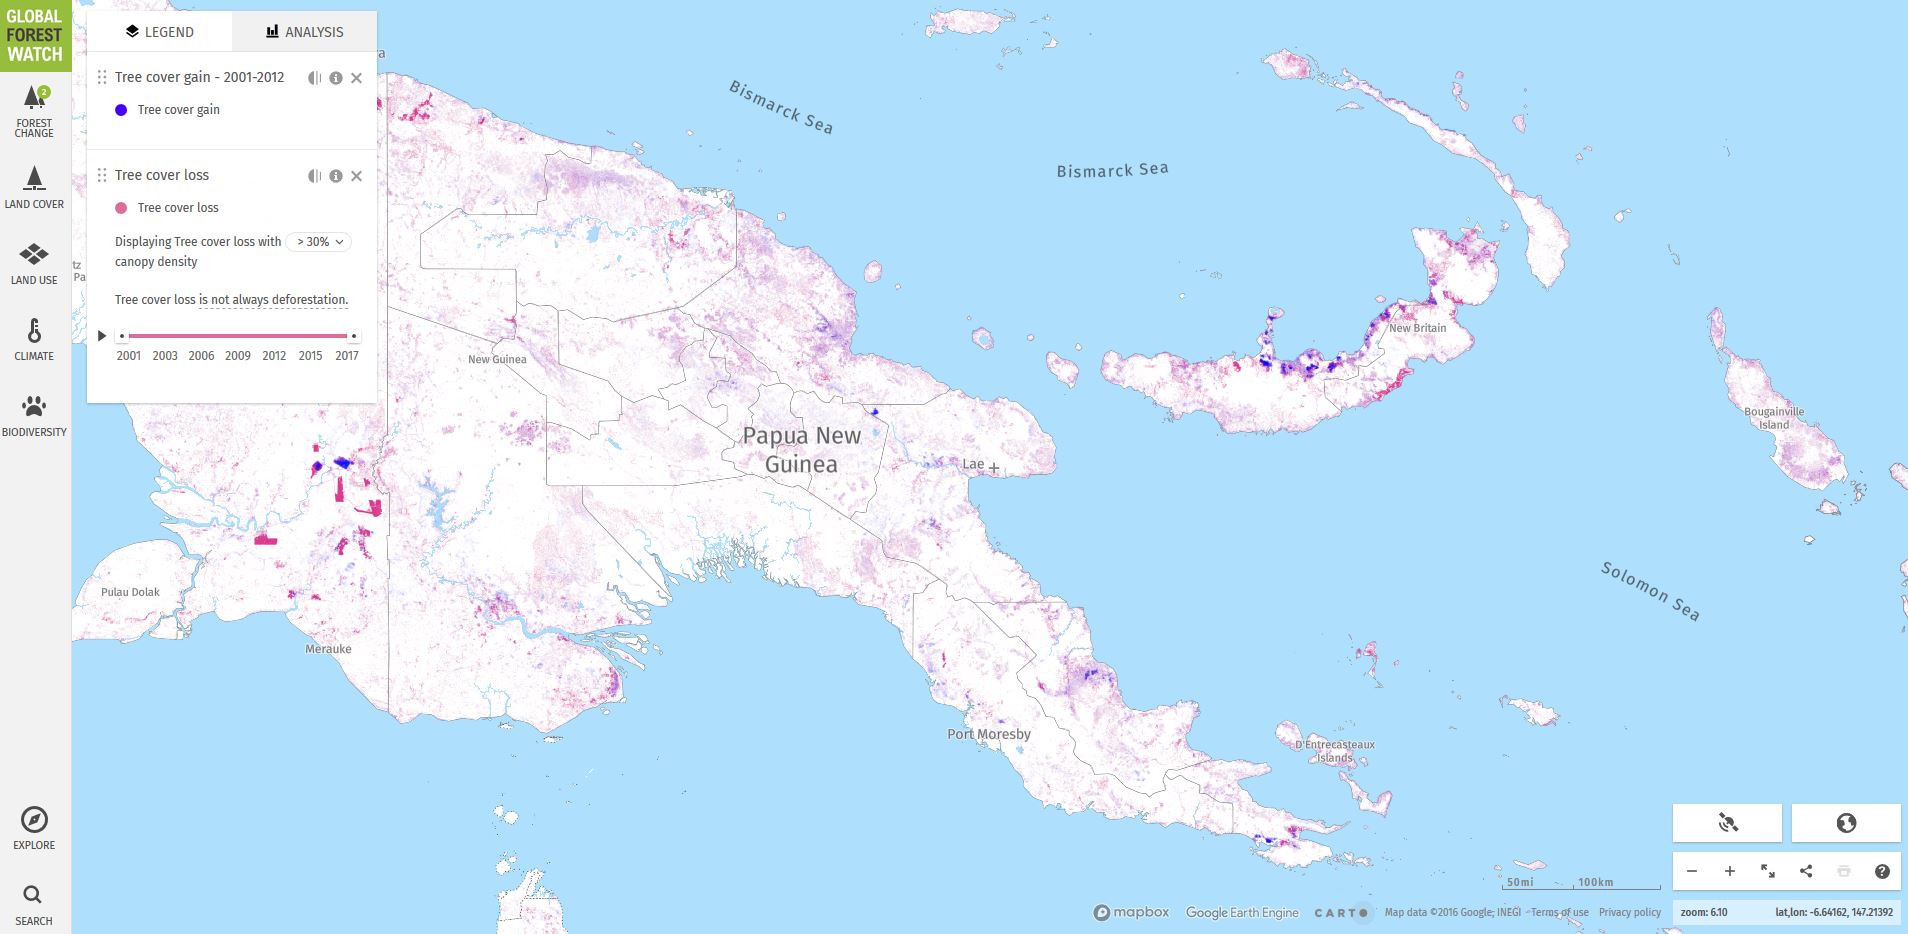
Map showing tree cover gain (2001-2012) and tree cover loss (2001-2017) in PNG.
Screenshot from the Interactive Map on the Global Forest Watch website.
The Piu Biogas system is located in Falealili District. The Biogas system is in pilot phase where it is co managed by both the Ministry of Natural Resources - Renewable Energy Division and the Community of Piu.
This photo was uploaded by Roland
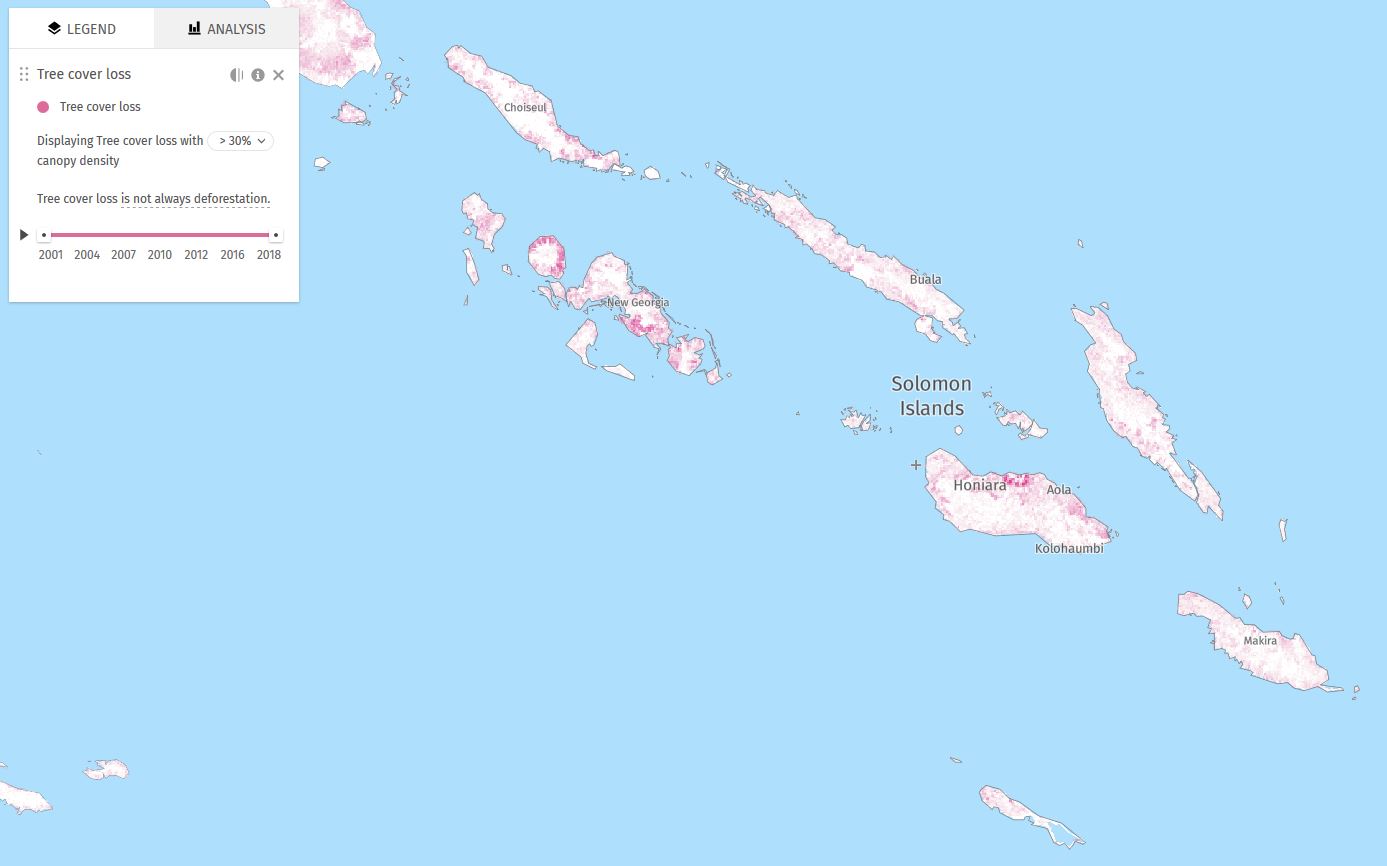
Map displaying tree cover loss with > 30% canopy density, between 2001-2018. Tree cover loss is not always deforestation. Global Forest Watch data.
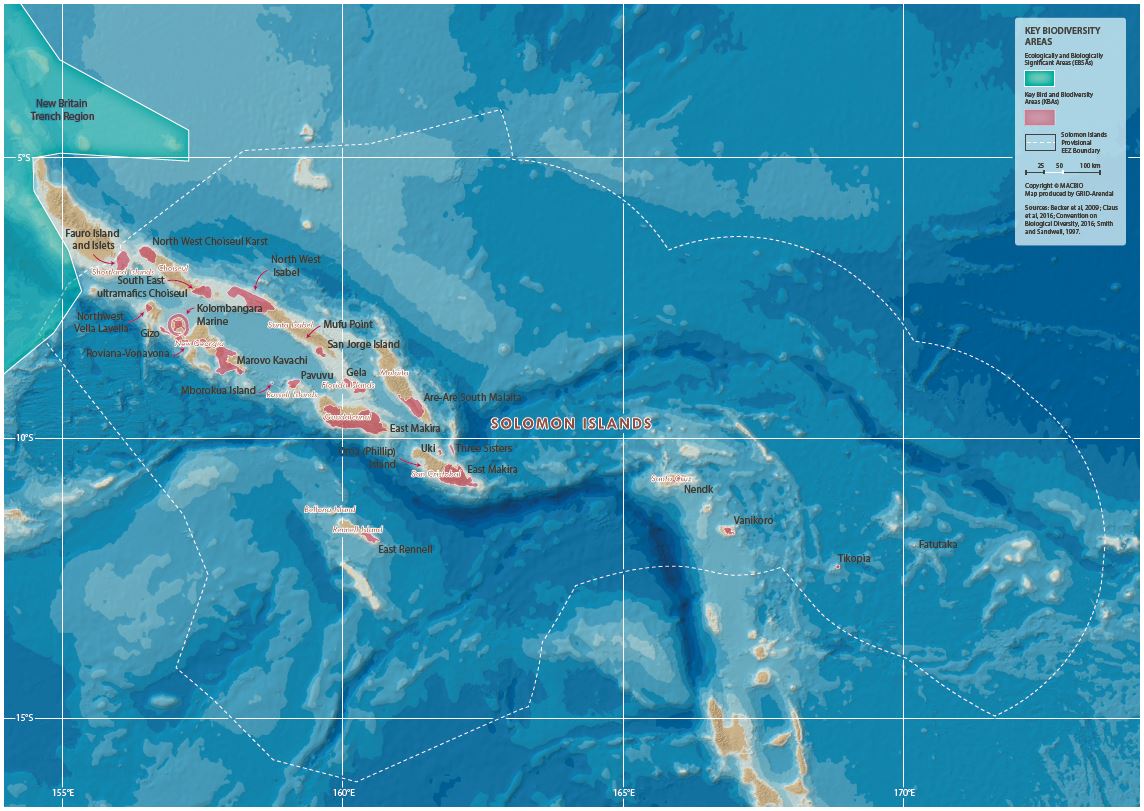
This is an example map from the Solomon Islands Marine Atlas. A series of maps from the Marine Atlas are uploaded as separate datasets to this portal. Use the search box or filter by the keyword/tag "maps".
The amended Code of the Federated States of Micronesia states in section 104 that the exclusive economic zone is contiguous to the territorial sea. The inner boundary of the exclusive economic zone of each island or atoll is the seaward boundary of the territorial sea, and the outer boundary is a line, every point of which is two hundred nautical miles seaward of the nearest point on the baseline.
The Gridded Population of the World, Version 4 (GPWv4): Population Density, Revision 11 consists of estimates of human population density (number of persons per square kilometer) based on counts consistent with national censuses and population registers, for the years 2000. A proportional allocation gridding algorithm, utilizing approximately 13.5 million national and sub-national administrative units, was used to assign population counts to 30 arc-second grid cells.
The Gridded Population of the World, Version 4 (GPWv4): Population Density, Revision 11 consists of estimates of human population density (number of persons per square kilometer) based on counts consistent with national censuses and population registers, for the year 2005. A proportional allocation gridding algorithm, utilizing approximately 13.5 million national and sub-national administrative units, was used to assign population counts to 30 arc-second grid cells.
The Gridded Population of the World, Version 4 (GPWv4): Population Density, Revision 11 consists of estimates of human population density (number of persons per square kilometer) based on counts consistent with national censuses and population registers, for the year 2010. A proportional allocation gridding algorithm, utilizing approximately 13.5 million national and sub-national administrative units, was used to assign population counts to 30 arc-second grid cells.
The Gridded Population of the World, Version 4 (GPWv4): Population Density, Revision 11 consists of estimates of human population density (number of persons per square kilometer) based on counts consistent with national censuses and population registers, for the year 2015. A proportional allocation gridding algorithm, utilizing approximately 13.5 million national and sub-national administrative units, was used to assign population counts to 30 arc-second grid cells.
The Gridded Population of the World, Version 4 (GPWv4): Population Density, Revision 11 consists of estimates of human population density (number of persons per square kilometer) based on counts consistent with national censuses and population registers, for the year 2020. A proportional allocation gridding algorithm, utilizing approximately 13.5 million national and sub-national administrative units, was used to assign population counts to 30 arc-second grid cells.
Raster data representing the mean levels of chlorophyll in mg/m3 for the surface water layer. The data are available for global-scale applications at a spatial resolution of 5 arcmin (approximately 9.2 km at the equator).
Marine data layers for present conditions were produced with climate data describing monthly averages for the period 2000–2014, obtained from pre-processed global ocean re-analyses combining satellite and in situ observations at regular two- and three-dimensional spatial grids.
Raster data representing the mean levels of nitrate in µmol/m3 for the surface water layer. The data are available for global-scale applications at a spatial resolution of 5 arcmin (approximately 9.2 km at the equator).
Marine data layers for present conditions were produced with climate data describing monthly averages for the period 2000–2014, obtained from pre-processed global ocean re-analyses combining satellite and in situ observations at regular two- and three-dimensional spatial grids.