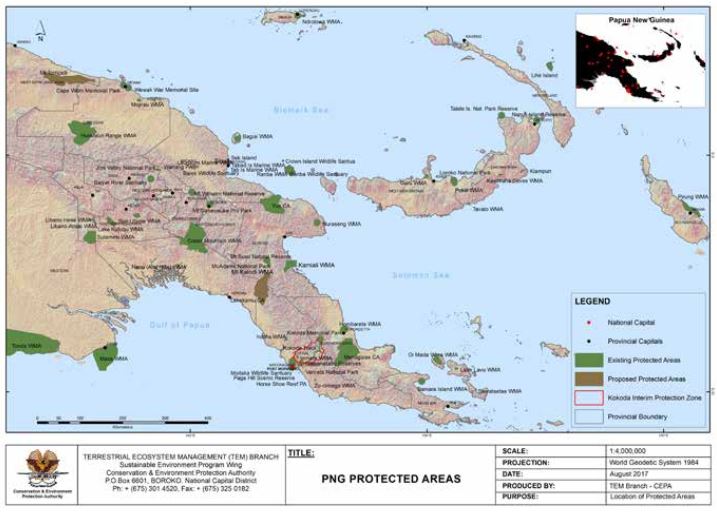
Map with existing and proposed protected areas in PNG. Status on August 2017. Produced by CEPA.
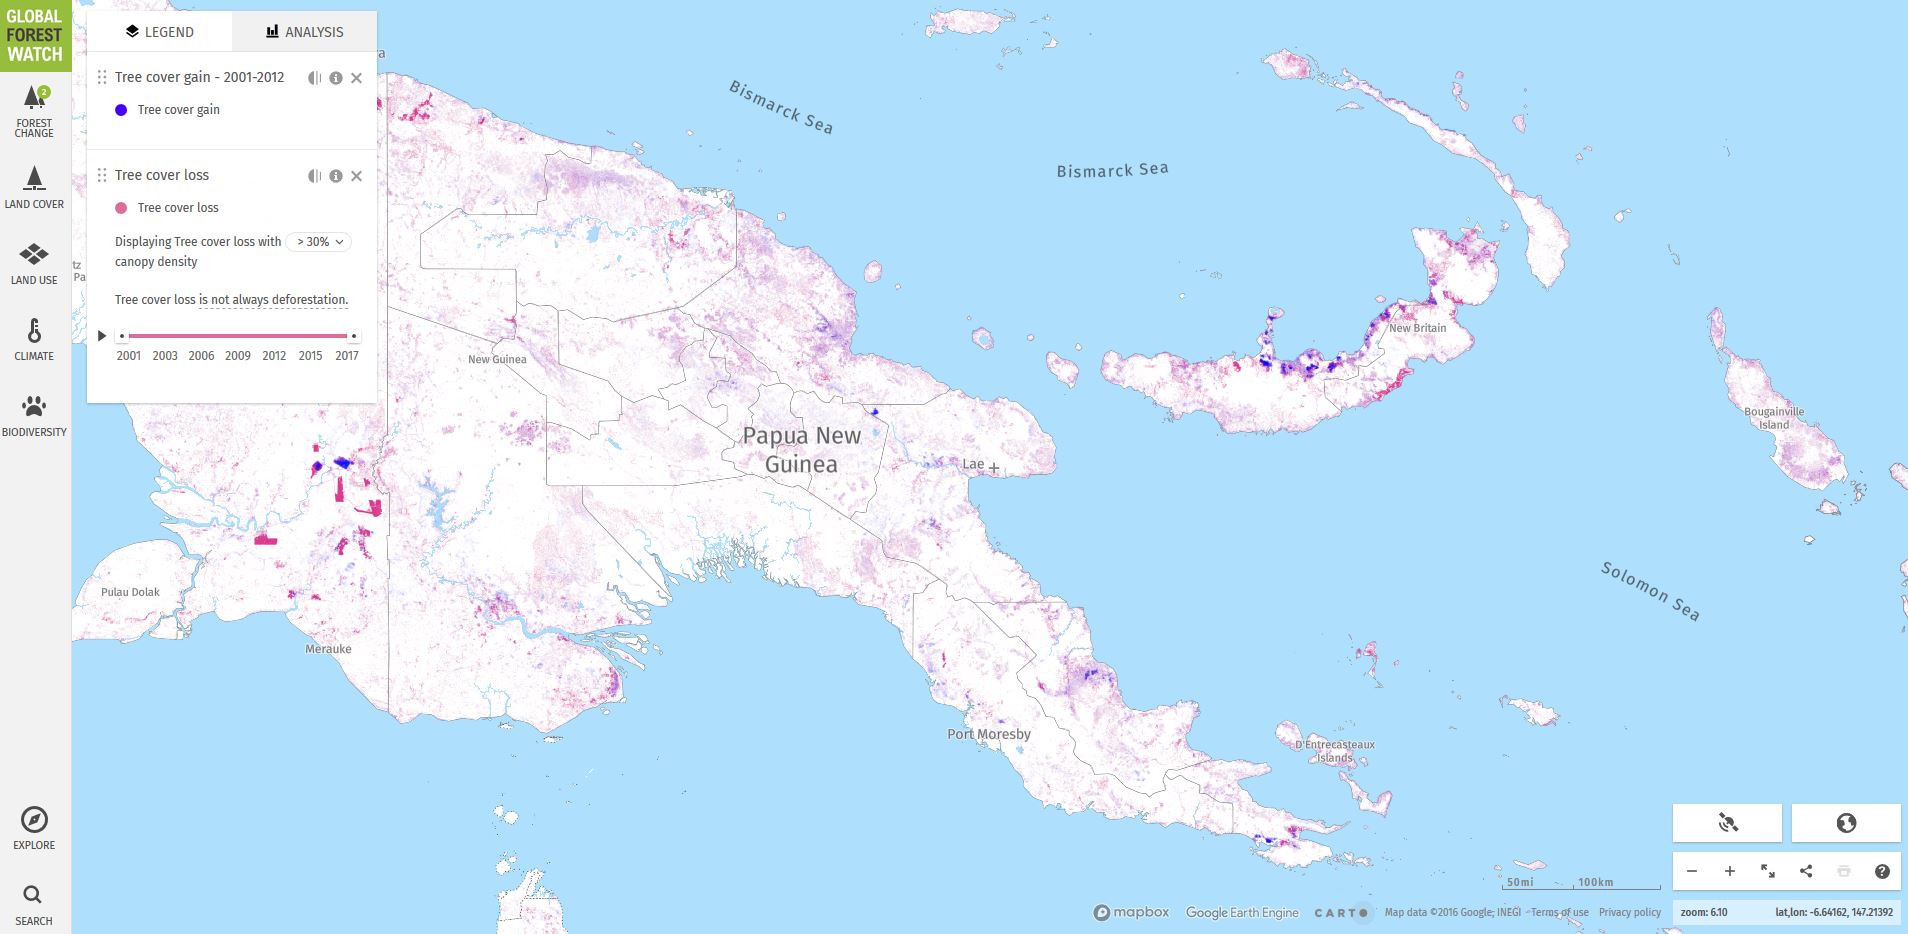
Map showing tree cover gain (2001-2012) and tree cover loss (2001-2017) in PNG.
Screenshot from the Interactive Map on the Global Forest Watch website.
The Piu Biogas system is located in Falealili District. The Biogas system is in pilot phase where it is co managed by both the Ministry of Natural Resources - Renewable Energy Division and the Community of Piu.
This photo was uploaded by Roland
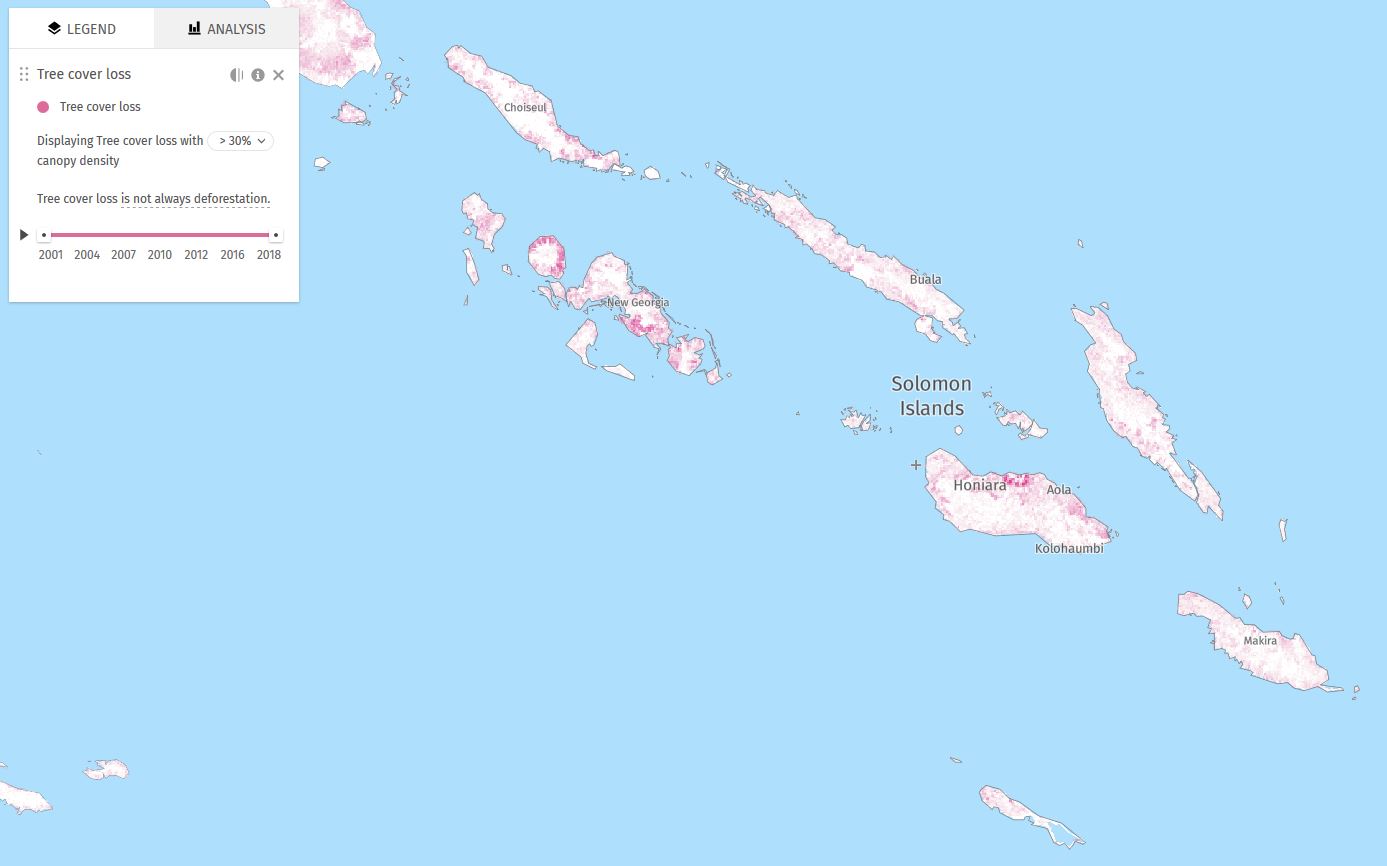
Map displaying tree cover loss with > 30% canopy density, between 2001-2018. Tree cover loss is not always deforestation. Global Forest Watch data.
The full global assessment can be downloaded from the GCRMN website.
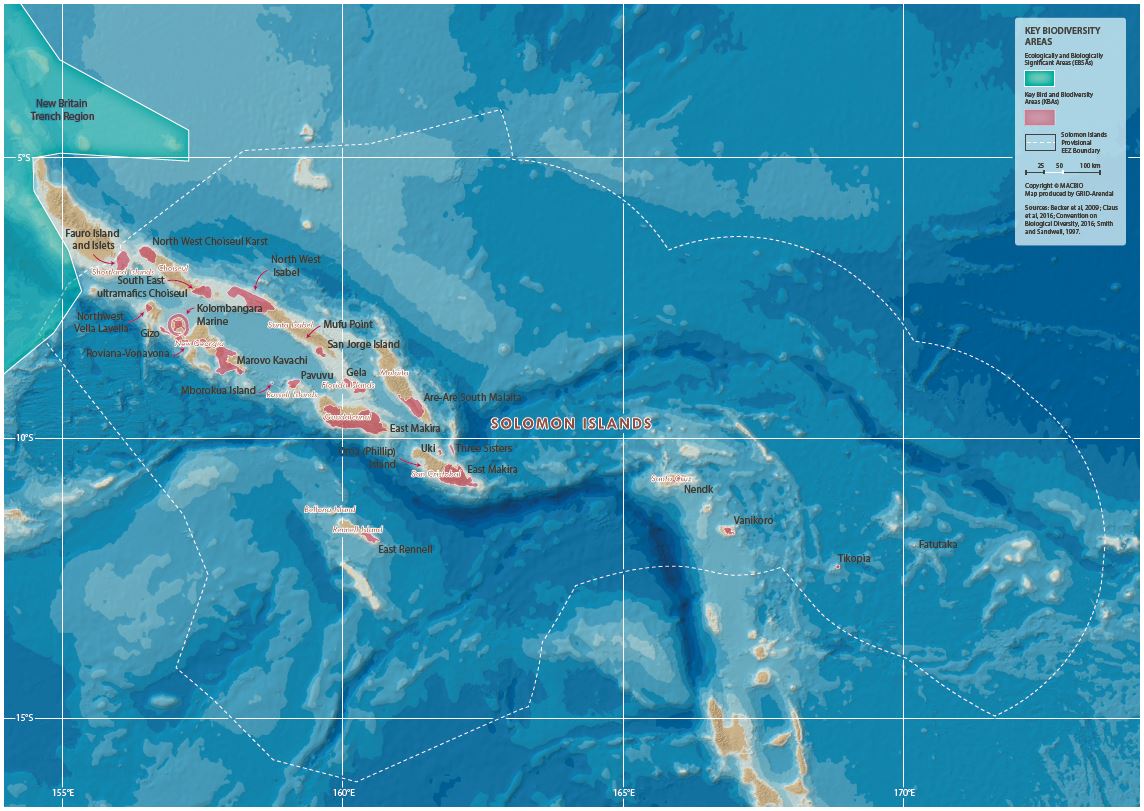
This is an example map from the Solomon Islands Marine Atlas. A series of maps from the Marine Atlas are uploaded as separate datasets to this portal. Use the search box or filter by the keyword/tag "maps".
This shapefile shows the global 12 nautical miles zone. It can be opened in QGIS and Google Earth.
This is a shapefile layer that shows the global EEZ. It can be opened in any GIS software.
The maps highlights areas with significant shift in the shoreline by overlaying shoreline data from Nov 2021 and January 2022
The maps highlights areas with significant shift in the shoreline by overlaying shoreline data from Nov 2021 and January 2022
The WDPA User Manual provides information and guidance about the data held within the WDPA, including its history, how it is collected, managed and distributed, and how it should be interpreted and used for analyses and research. The Manual has been prepared for WDPA data providers and users. It is structured in 4 sections and includes 6 appendices.