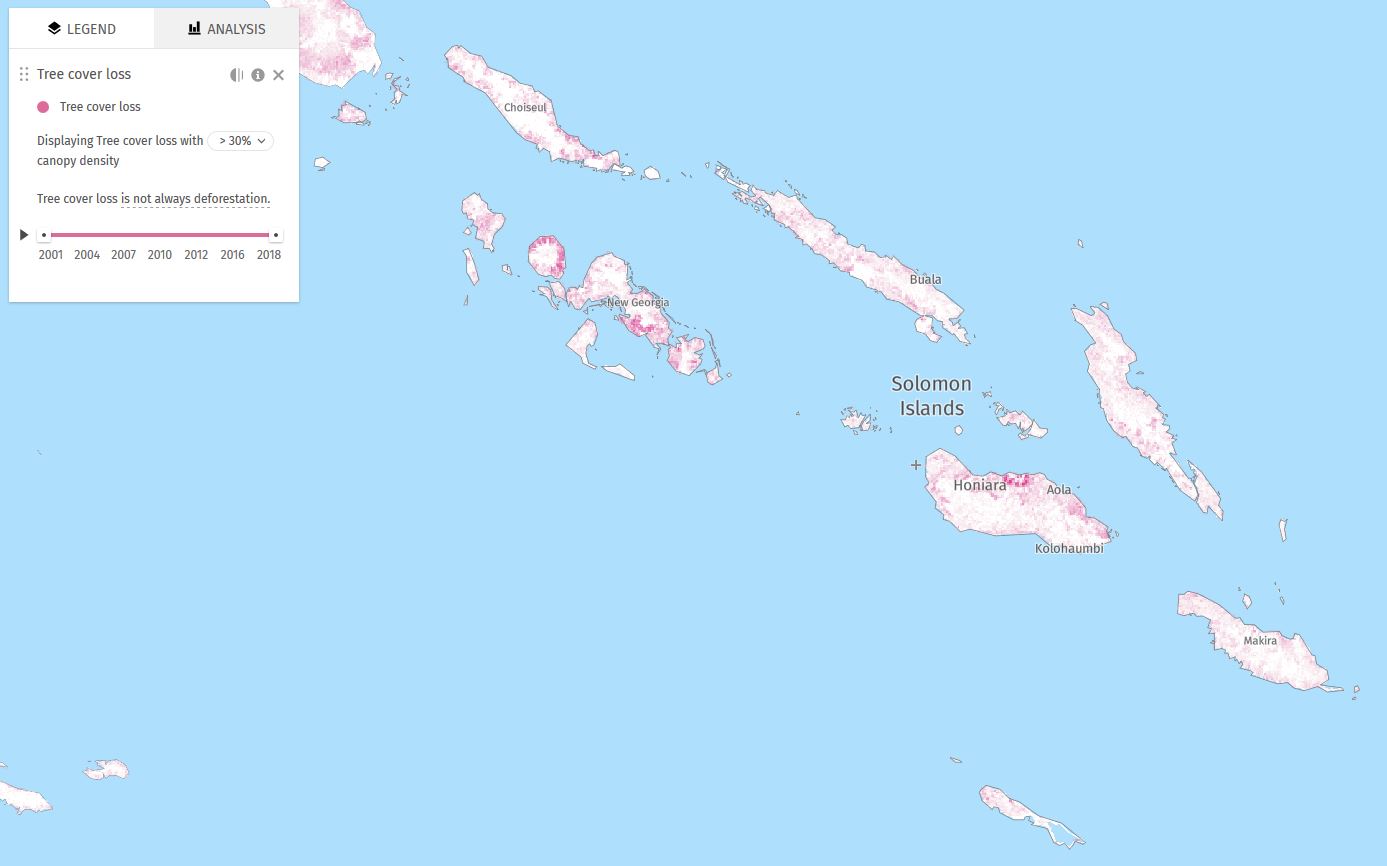
Map displaying tree cover loss with > 30% canopy density, between 2001-2018. Tree cover loss is not always deforestation. Global Forest Watch data.
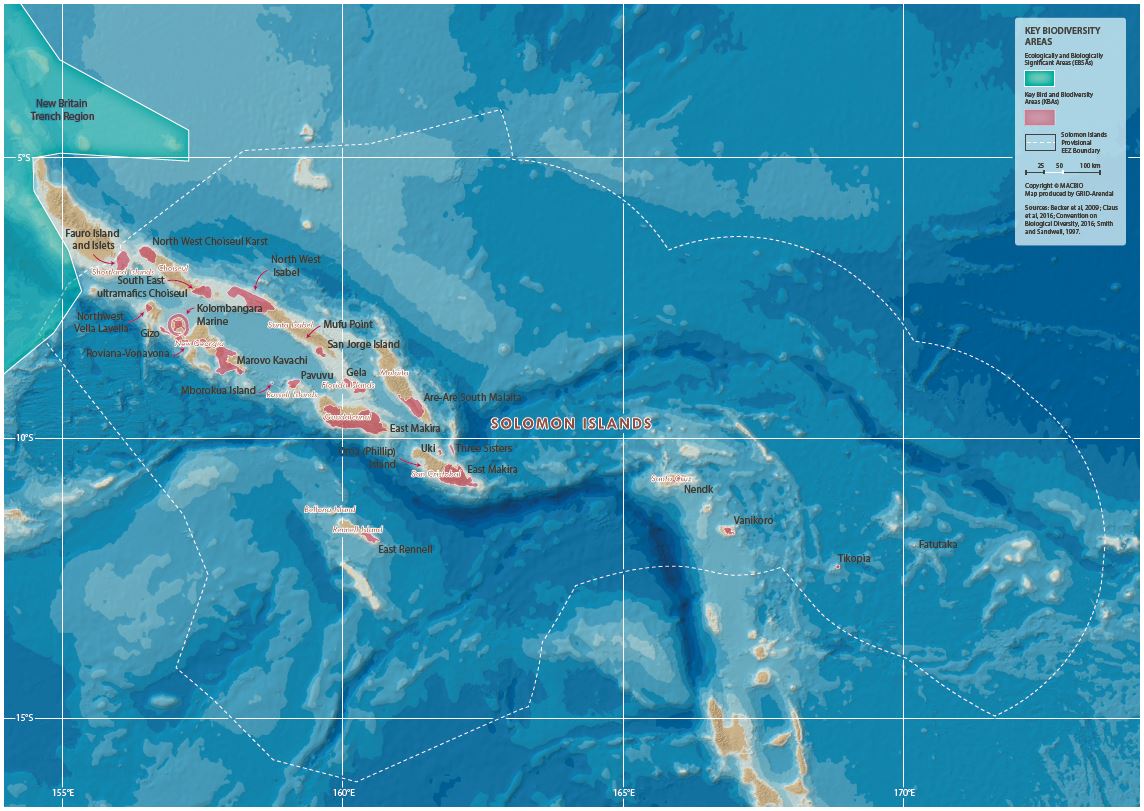
This is an example map from the Solomon Islands Marine Atlas. A series of maps from the Marine Atlas are uploaded as separate datasets to this portal. Use the search box or filter by the keyword/tag "maps".
The GEBCO_2019 Grid is a global grid of elevation data at 15 arc-second intervals. This layer displays the GEBCO_2019 Grid as a shaded relief image showing the shape of the global seafloor. The imagery extends from -180 to 360 in longitude. Please note that the GEBCO_2019, is also available as 2D, flat image in layer GEBCO_2019_Grid_2.
This is a test for upload invasive species document
Rarotonga Water intakes and Streams
steams and water intakes rarotonga 2014 or older
Map of the protected areas for Northern Islands, Cook Islands with country-level summary statistics on the amount of area under protection, count for each type of protected area (terrestrial or marine), and the count of their designation.
Map of the protected areas for Southern Islands, Cook Islands with country-level summary statistics on the amount of area under protection, count for each type of protected area (terrestrial or marine), and the count of their designation.
Map of the protected areas for Nauru with country-level summary statistics on the amount of area under protection, count for each type of protected area (terrestrial or marine), and the count of their designation.