Map showing the different uses that put pressure on the marine environment. This includes among others vessel tracts, fisheries data, protected and restricted areas. Data sources are:
UNEP/CBD/EBSA/WSPAC/1/2. 2011. Compilation of Scientific Information to Describe EBSAs in the Western South Pacific Region.
KBAs: CEPF
DSM Tenements: Ministry of Lands and Survey, Solomon Islands
Shipping Routes: Solomon Islands Maritime and Ports Authority (SIPA)
Marine Managed Areas: CTAtlas
Vessel Tracks: Exact AIS
The Forest and land use composition of the Solomon Islands study in 2016, shows 7.77% of the total land area was ‘cropland’. Cropland itself comprises 2176 square kilometres. In 2016 the dominant crop type was mixed subsistence agriculture followed by coconut, mixed crops (including coconut overstory) and palm oil Cocoa and ‘other’ agriculture make up the remaining area under cultivation. Includes pie chart.
Excel version of the data on tree cover loss extracted from Global Forest Watch.
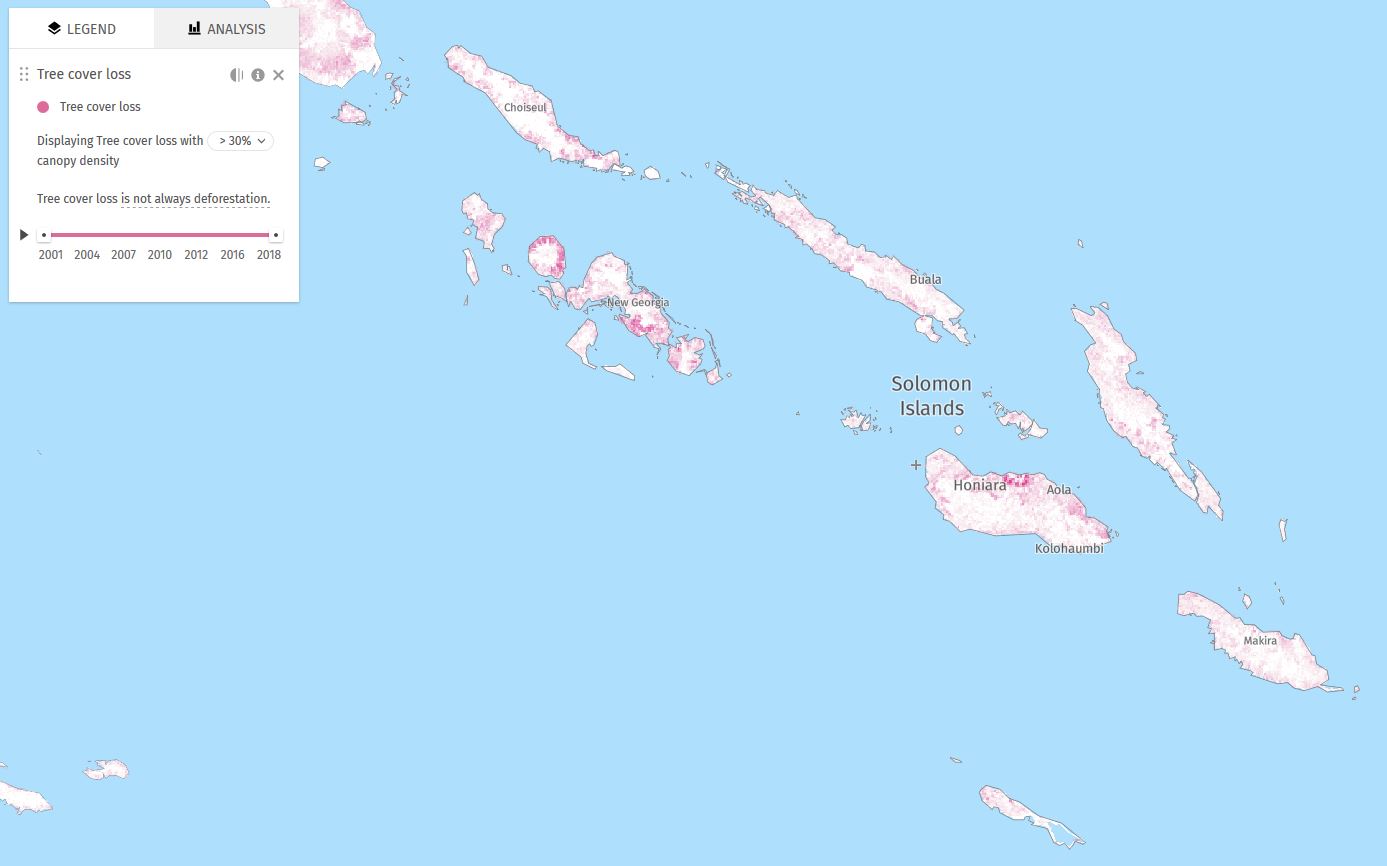
Map displaying tree cover loss with > 30% canopy density, between 2001-2018. Tree cover loss is not always deforestation. Global Forest Watch data.
An excel extraction of the data from the internet link resource
This graph shows the profile of languages in Solomon Islands with respect to their status of language development versus language endangerment. Each individual language that has an entry for Solomon Islands is included in the profile. Adapted from https://www.ethnologue.com/profile/SB.
The dolphin hunts in the Solomon Islands are typically conducted between January and April, when the seas are calm. Home to the largest drive slaughter of dolphins in the world, annual kills between the years 1976-2013 averaged 850 dolphins per year. Since Dolphin Project began a full-time campaign in 2015 in Fanalei, Solomon Islands, slaughters have dropped to a four-year average of 247 dolphins.
The bolded ecosystem services in this table are likely to be less resilient to future climate conditions
*please refer to Honiara Ecosystem Based Adaptation assessment and masterplan report for narration and further information*
Prioritized EbA adaptation options
*please refer to Honiara Ecosystem Adaptation Assessment report for narration and further information*
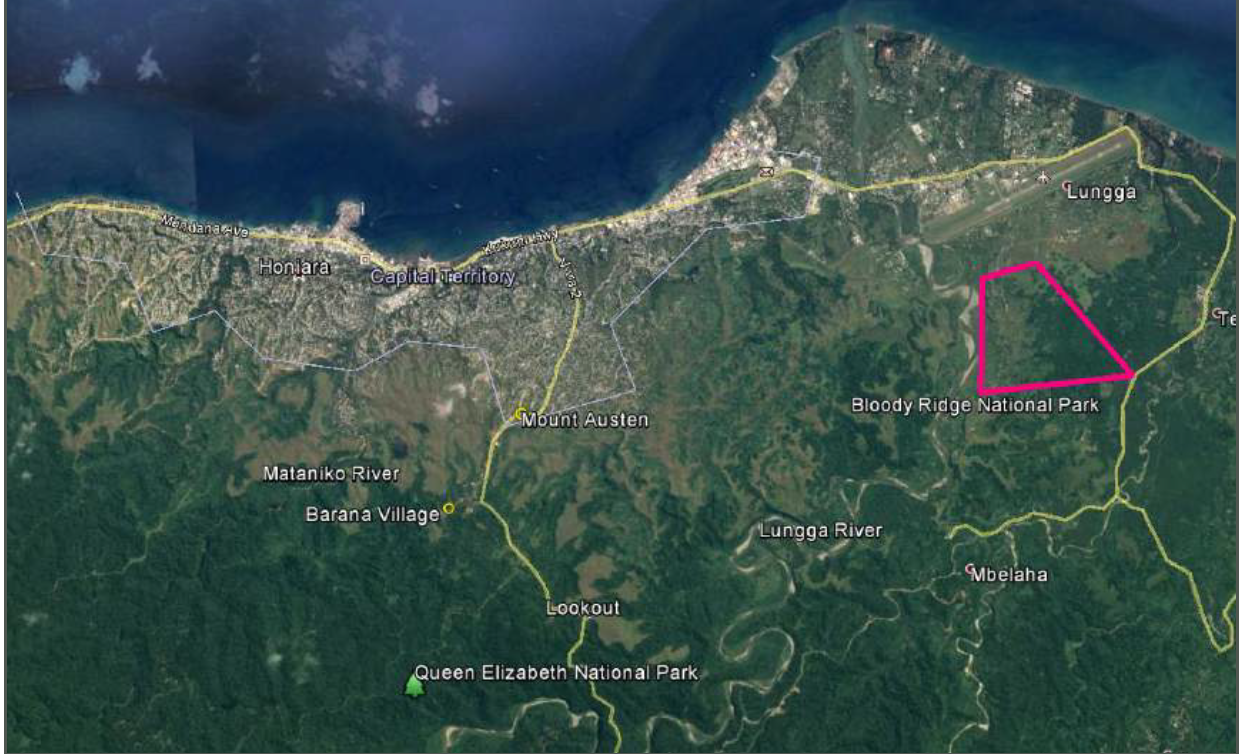
Indication of location for the establishment of the Barana and Queen Elizabeth Park to improve the upper Mataniko and Lungga catchment area’s provision of fresh water supply and other ecosystem services.
*refer to Honiara Ecosystem Based Adaptation Option Assessment report for more detailed information*
In most villages, affected families lost on average 1 canoe or less, but from the 40 households in Tapurai predisaster, it was estimated that more than 58 canoes were lost.
*data extracted from the pdf report*
Villagers explained that losses of fishing gear were related to the destruction of houses. Fishing gear (lines, goggles, spears etc.) was stored within houses and if a house was washed away by the wave then all gear was lost. An indication of the types of gear that were lost or damaged in the tsunami is given in this data, based on individual interviews with fisher.
*data extracted from pdf report*