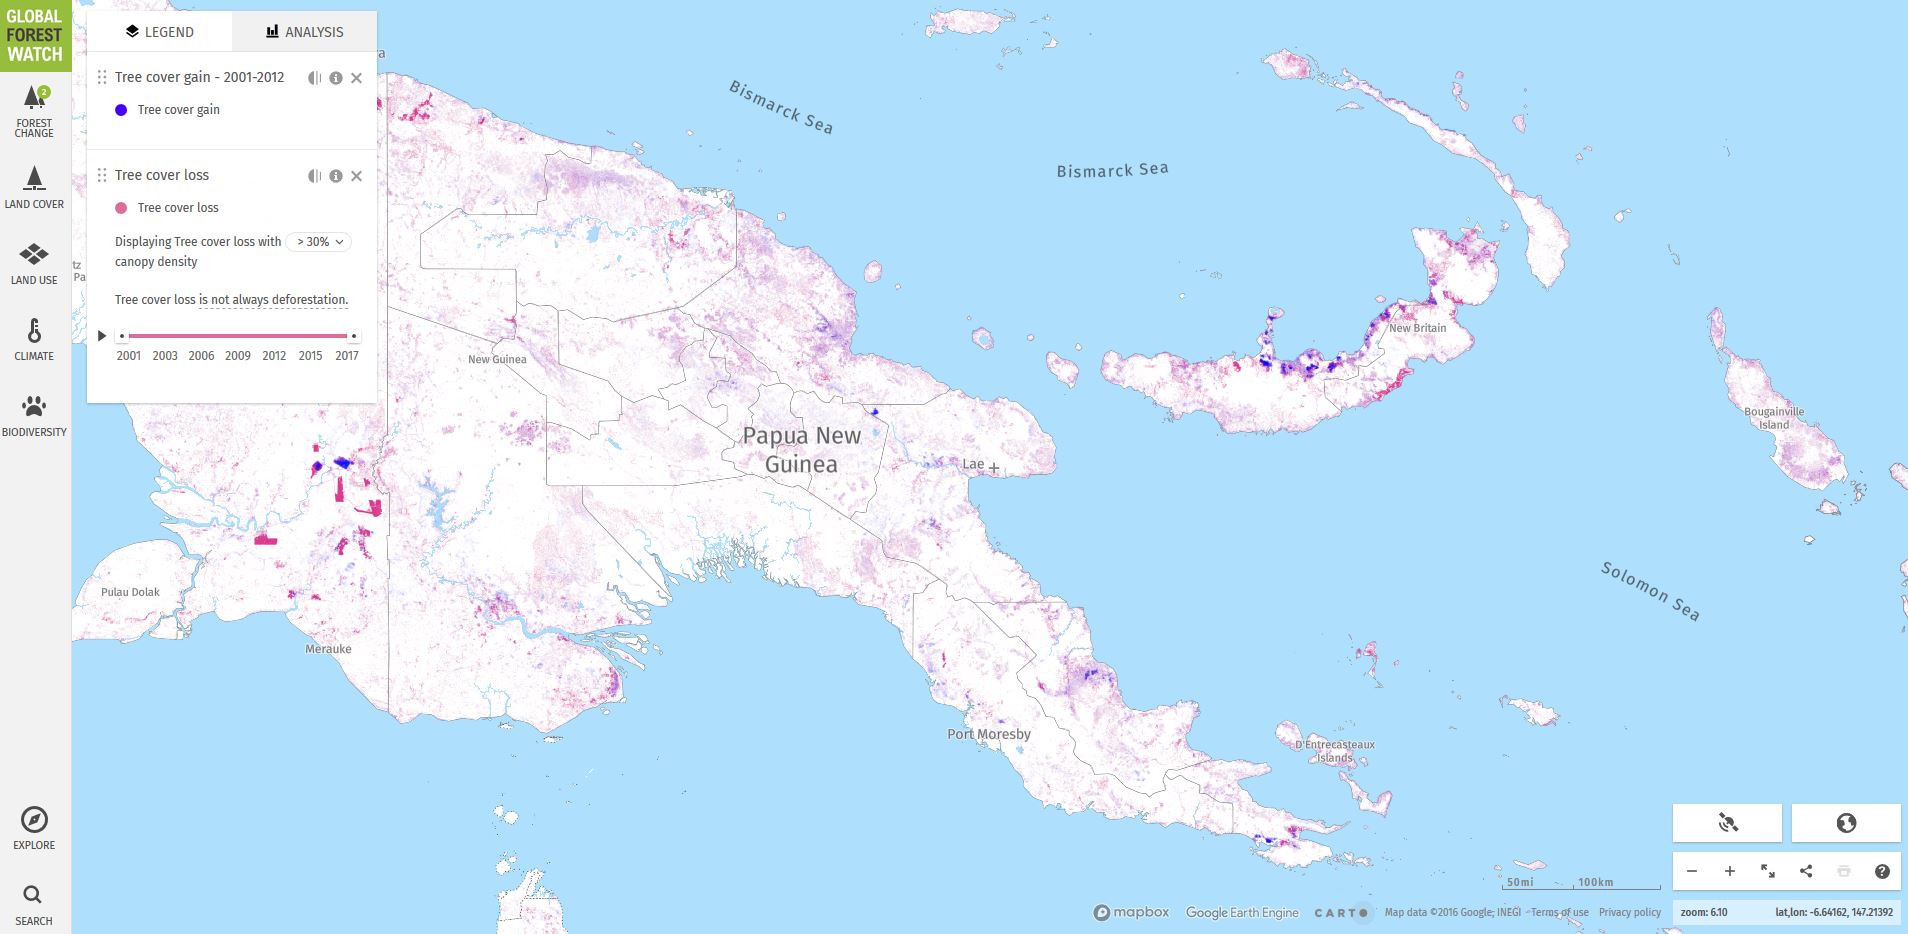
Map showing tree cover gain (2001-2012) and tree cover loss (2001-2017) in PNG.
Screenshot from the Interactive Map on the Global Forest Watch website.
The Piu Biogas system is located in Falealili District. The Biogas system is in pilot phase where it is co managed by both the Ministry of Natural Resources - Renewable Energy Division and the Community of Piu.
This photo was uploaded by Roland
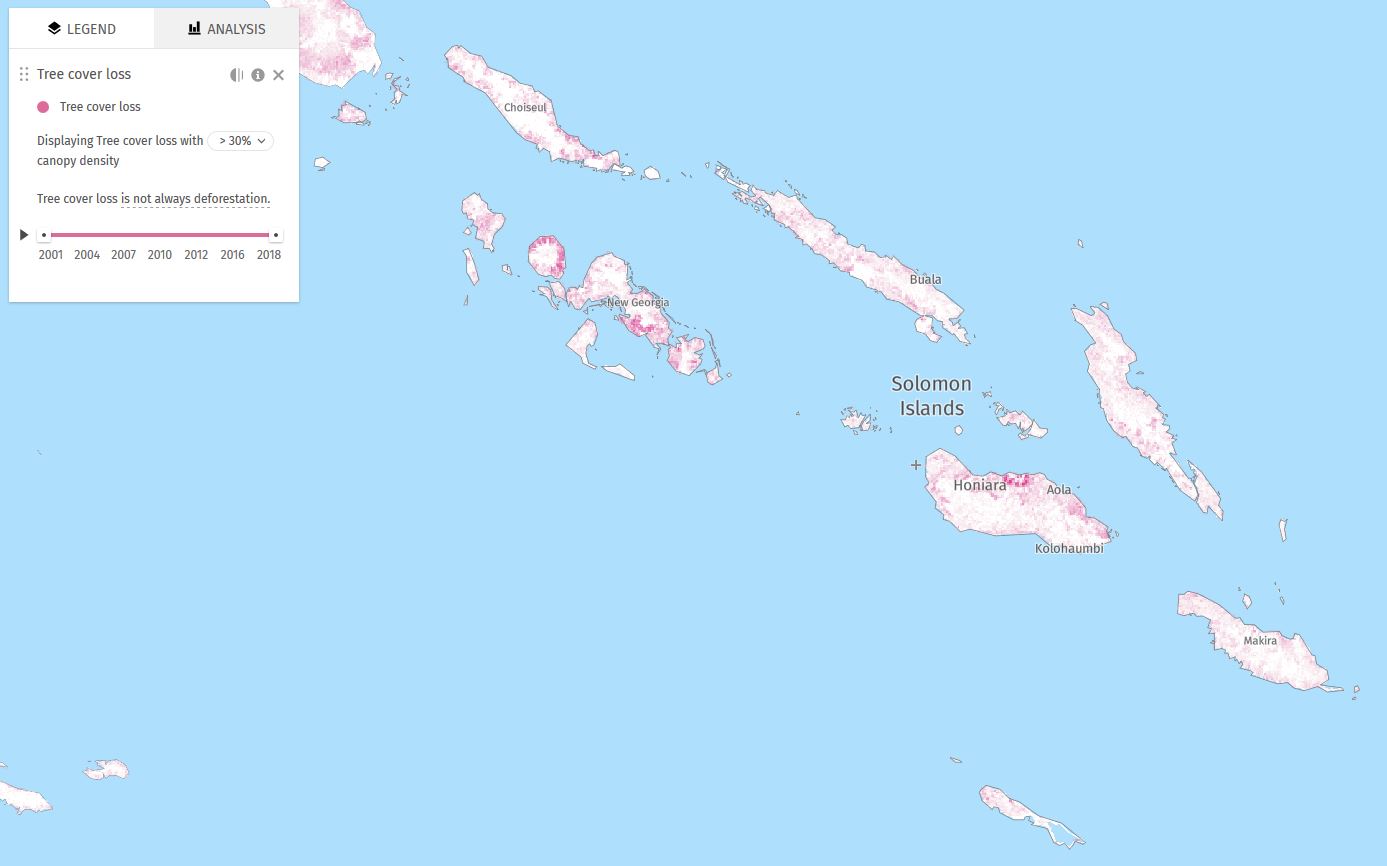
Map displaying tree cover loss with > 30% canopy density, between 2001-2018. Tree cover loss is not always deforestation. Global Forest Watch data.
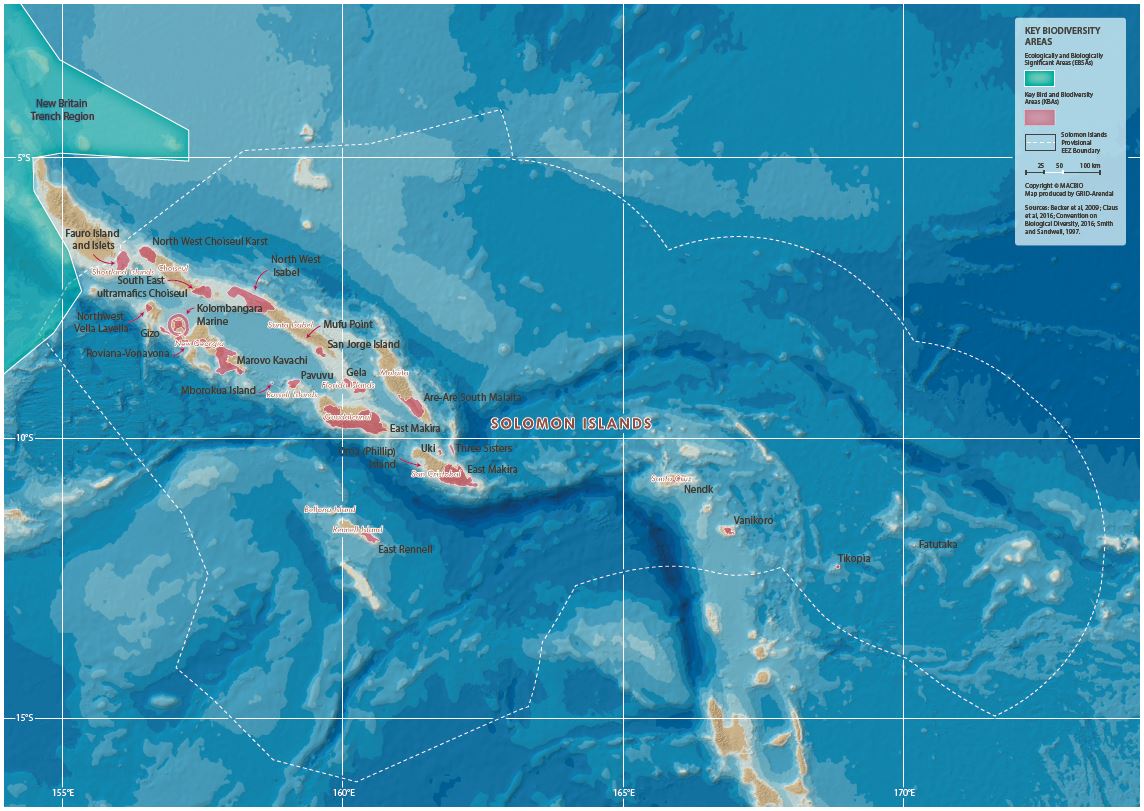
This is an example map from the Solomon Islands Marine Atlas. A series of maps from the Marine Atlas are uploaded as separate datasets to this portal. Use the search box or filter by the keyword/tag "maps".
The GEBCO_2019 Grid is a global grid of elevation data at 15 arc-second intervals. This layer displays the GEBCO_2019 Grid as a shaded relief image showing the shape of the global seafloor. The imagery extends from -180 to 360 in longitude. Please note that the GEBCO_2019, is also available as 2D, flat image in layer GEBCO_2019_Grid_2.
This shapefile shows the global 12 nautical miles zone. It can be opened in QGIS and Google Earth.
This is a shapefile layer that shows the global EEZ. It can be opened in any GIS software.
State of Environment and Conservation in the Pacific Islands: 2020 Regional Report
Dedicated interactive website for the State of Environment and Conservation in the Pacific Islands: 2020 Regional Report.
This is a test for upload invasive species document
Rarotonga Water intakes and Streams
steams and water intakes rarotonga 2014 or older