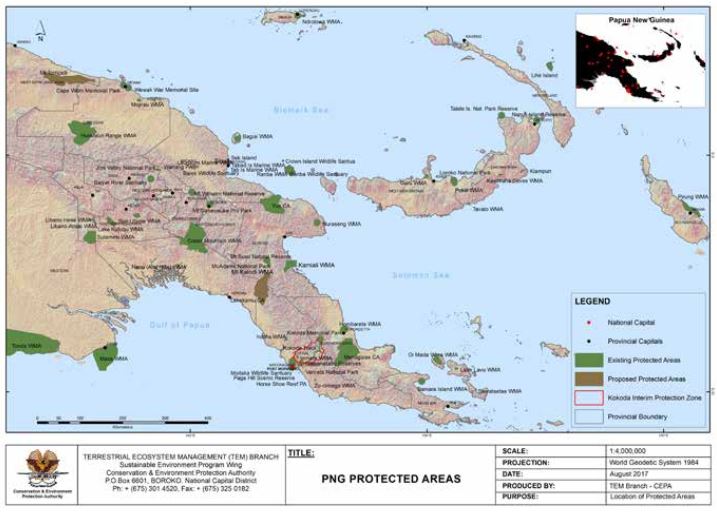
Map with existing and proposed protected areas in PNG. Status on August 2017. Produced by CEPA.
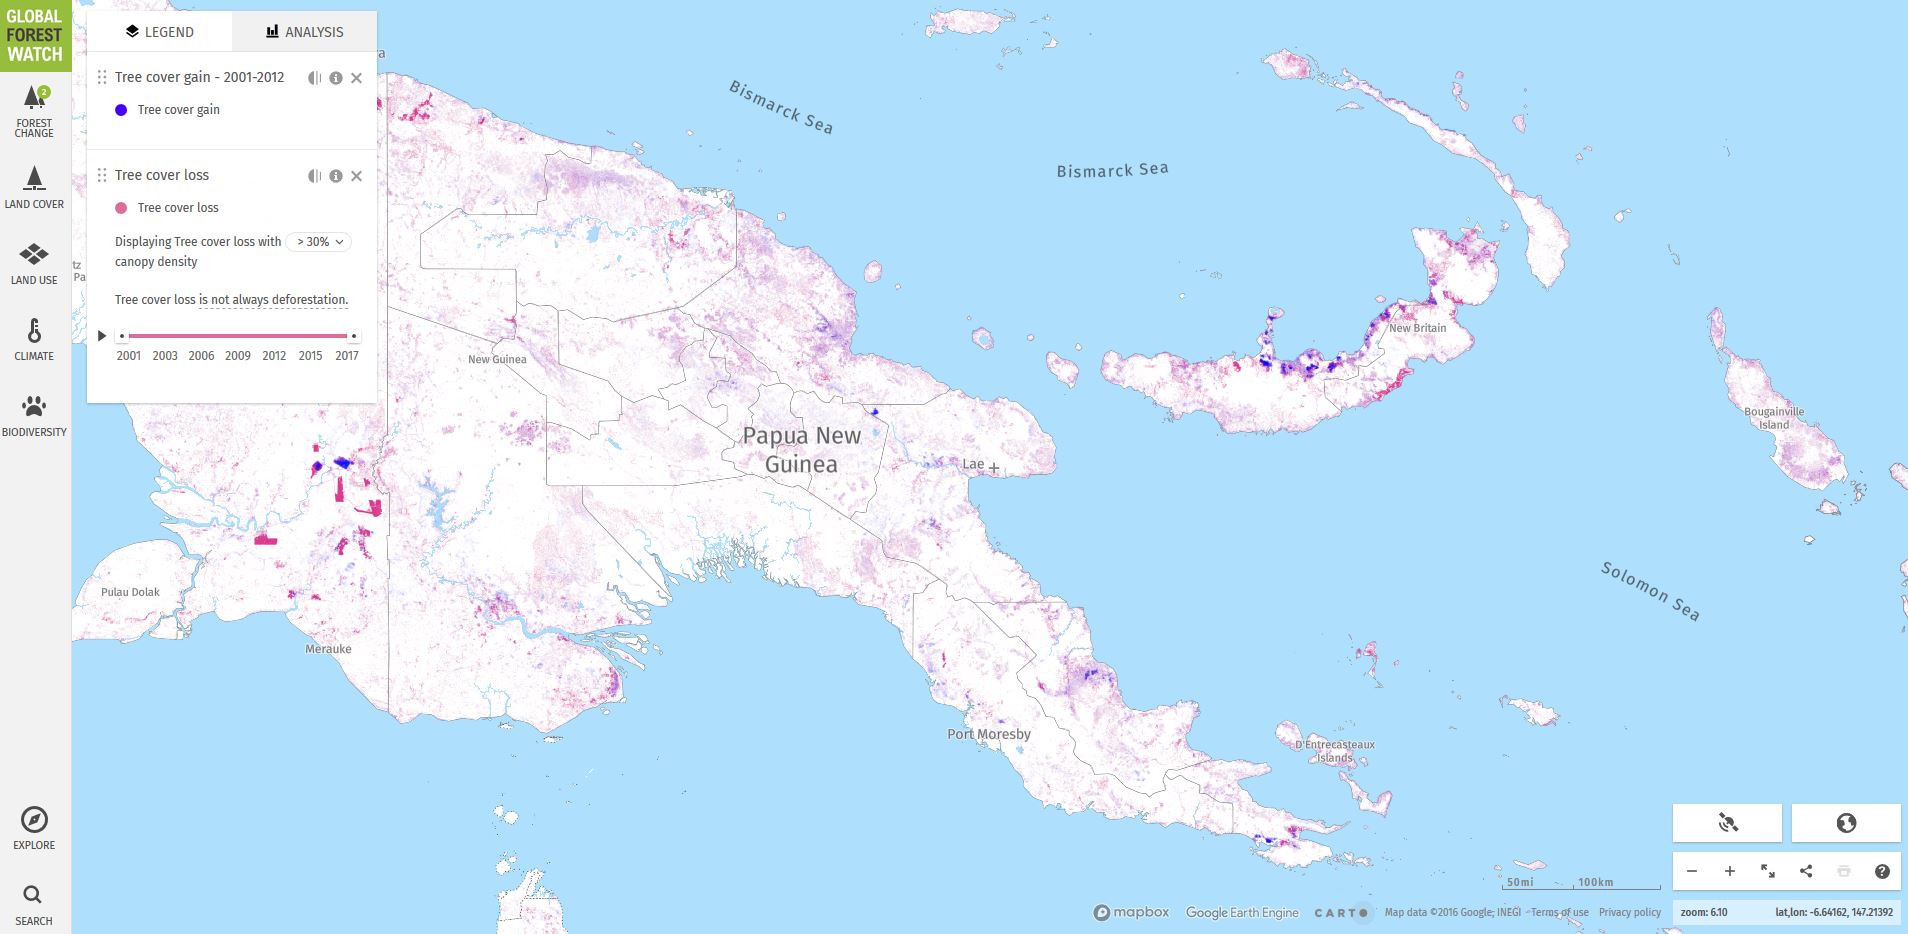
Map showing tree cover gain (2001-2012) and tree cover loss (2001-2017) in PNG.
Screenshot from the Interactive Map on the Global Forest Watch website.
The Piu Biogas system is located in Falealili District. The Biogas system is in pilot phase where it is co managed by both the Ministry of Natural Resources - Renewable Energy Division and the Community of Piu.
This photo was uploaded by Roland
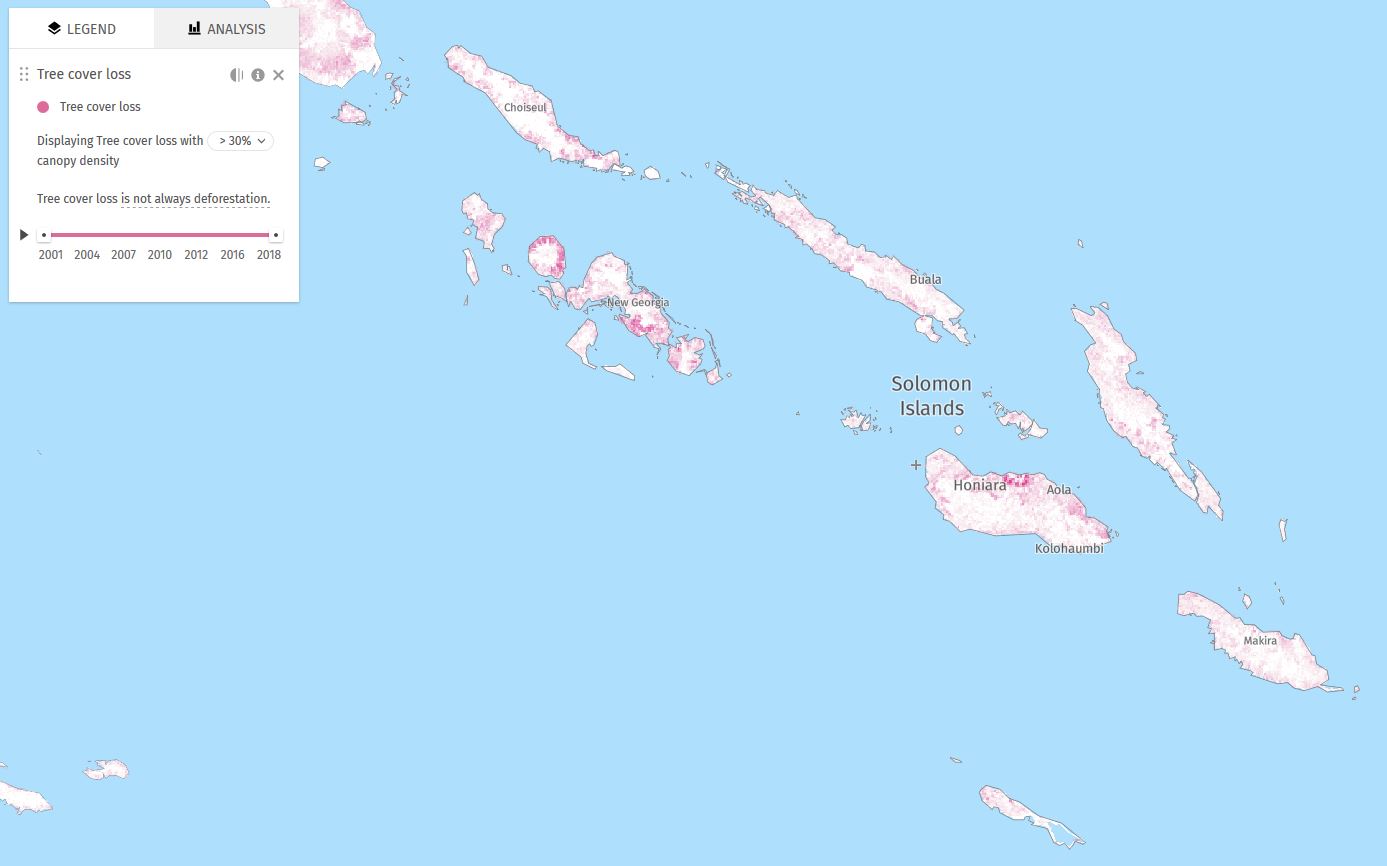
Map displaying tree cover loss with > 30% canopy density, between 2001-2018. Tree cover loss is not always deforestation. Global Forest Watch data.
The full global assessment can be downloaded from the GCRMN website.
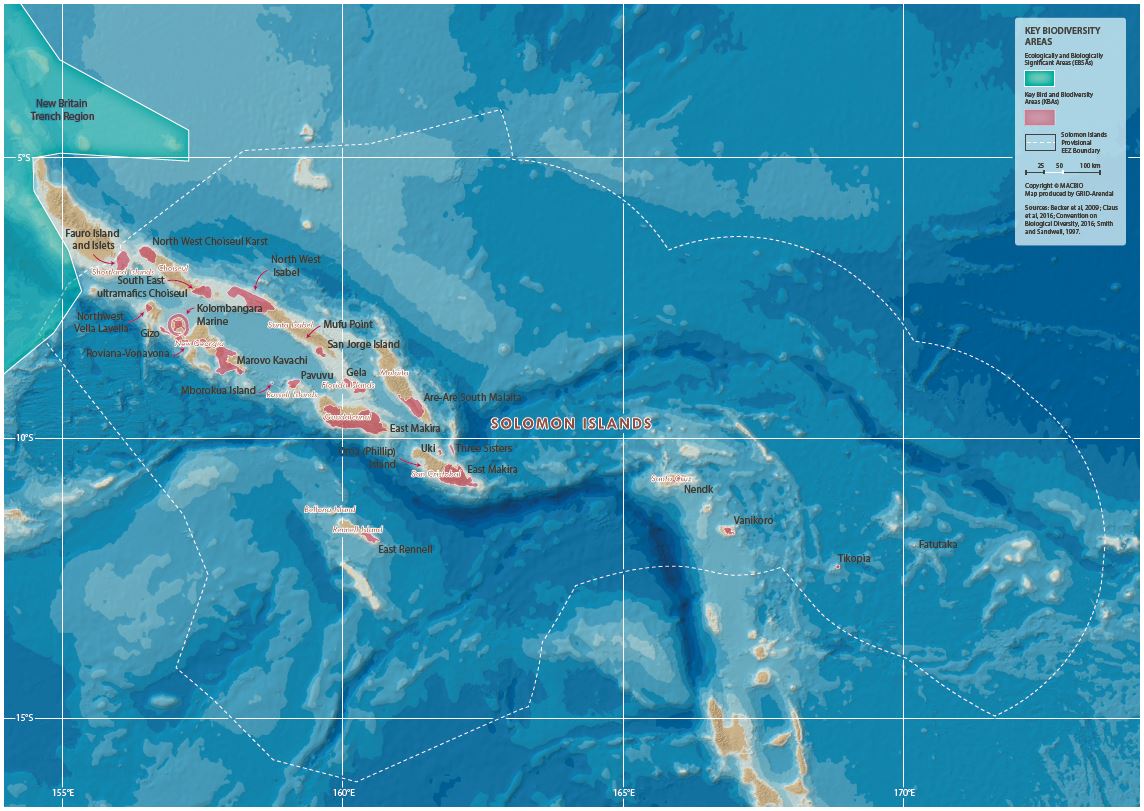
This is an example map from the Solomon Islands Marine Atlas. A series of maps from the Marine Atlas are uploaded as separate datasets to this portal. Use the search box or filter by the keyword/tag "maps".
The WDPA User Manual provides information and guidance about the data held within the WDPA, including its history, how it is collected, managed and distributed, and how it should be interpreted and used for analyses and research. The Manual has been prepared for WDPA data providers and users. It is structured in 4 sections and includes 6 appendices.
The Protected Areas Working Group (PAWG) of the Pacific Islands Round Table for Nature Conservation recommended a forum to better connect a diverse range of people and their work relating to protected and conserved areas. To increase efficacy with respect to gaining momentum with communications and conservation work, the Pacific Islands Protected Area Portal (PIPAP) was launched.
The Gridded Population of the World, Version 4 (GPWv4): Population Density, Revision 11 consists of estimates of human population density (number of persons per square kilometer) based on counts consistent with national censuses and population registers, for the years 2000. A proportional allocation gridding algorithm, utilizing approximately 13.5 million national and sub-national administrative units, was used to assign population counts to 30 arc-second grid cells.
The Gridded Population of the World, Version 4 (GPWv4): Population Density, Revision 11 consists of estimates of human population density (number of persons per square kilometer) based on counts consistent with national censuses and population registers, for the year 2005. A proportional allocation gridding algorithm, utilizing approximately 13.5 million national and sub-national administrative units, was used to assign population counts to 30 arc-second grid cells.
The Gridded Population of the World, Version 4 (GPWv4): Population Density, Revision 11 consists of estimates of human population density (number of persons per square kilometer) based on counts consistent with national censuses and population registers, for the year 2010. A proportional allocation gridding algorithm, utilizing approximately 13.5 million national and sub-national administrative units, was used to assign population counts to 30 arc-second grid cells.
The Gridded Population of the World, Version 4 (GPWv4): Population Density, Revision 11 consists of estimates of human population density (number of persons per square kilometer) based on counts consistent with national censuses and population registers, for the year 2015. A proportional allocation gridding algorithm, utilizing approximately 13.5 million national and sub-national administrative units, was used to assign population counts to 30 arc-second grid cells.