Presentation delivered by Mr. Unasa Nomeneta Saili from SkyEye on the use of GIS for the Measles nation-wide vaccination programme in 2019
Presentation delivered by Mr. Nomeneta Saili from Skyeye on the application of GIS to identify EPC assets that were damaged during the 2009 tsunami
Presentation delivered by Mr. Unasa Nomeneta Saili of SkyEye on the future for GIS for Samoa
Presentation delivered by Mr.James Atherton (vice president of Samoa Conservation Society) on the history and background of GIS and remote sensing in Samoa
An introductory presentation on what FOSS4G stands for and how the conference emerged.
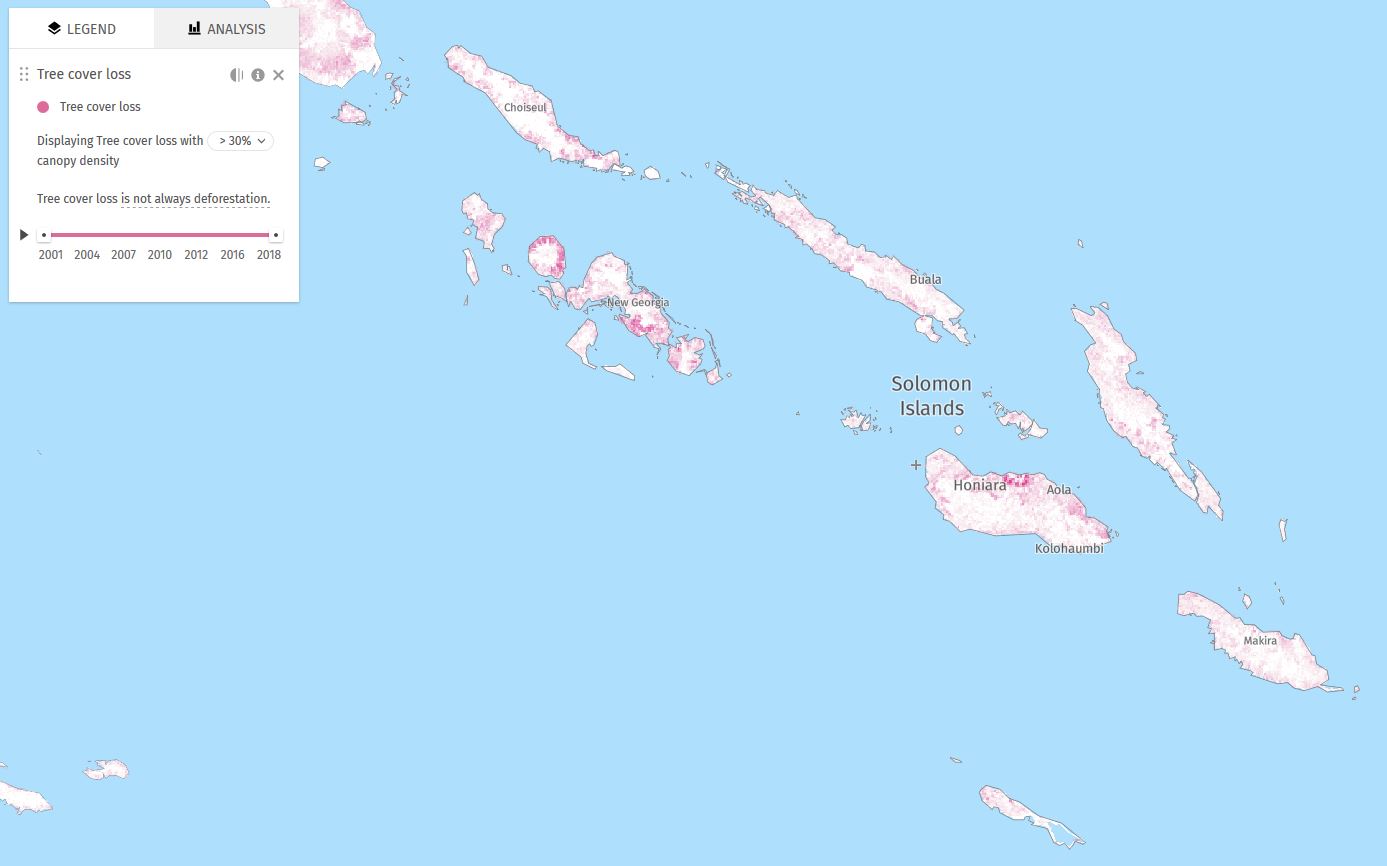
Map displaying tree cover loss with > 30% canopy density, between 2001-2018. Tree cover loss is not always deforestation. Global Forest Watch data.
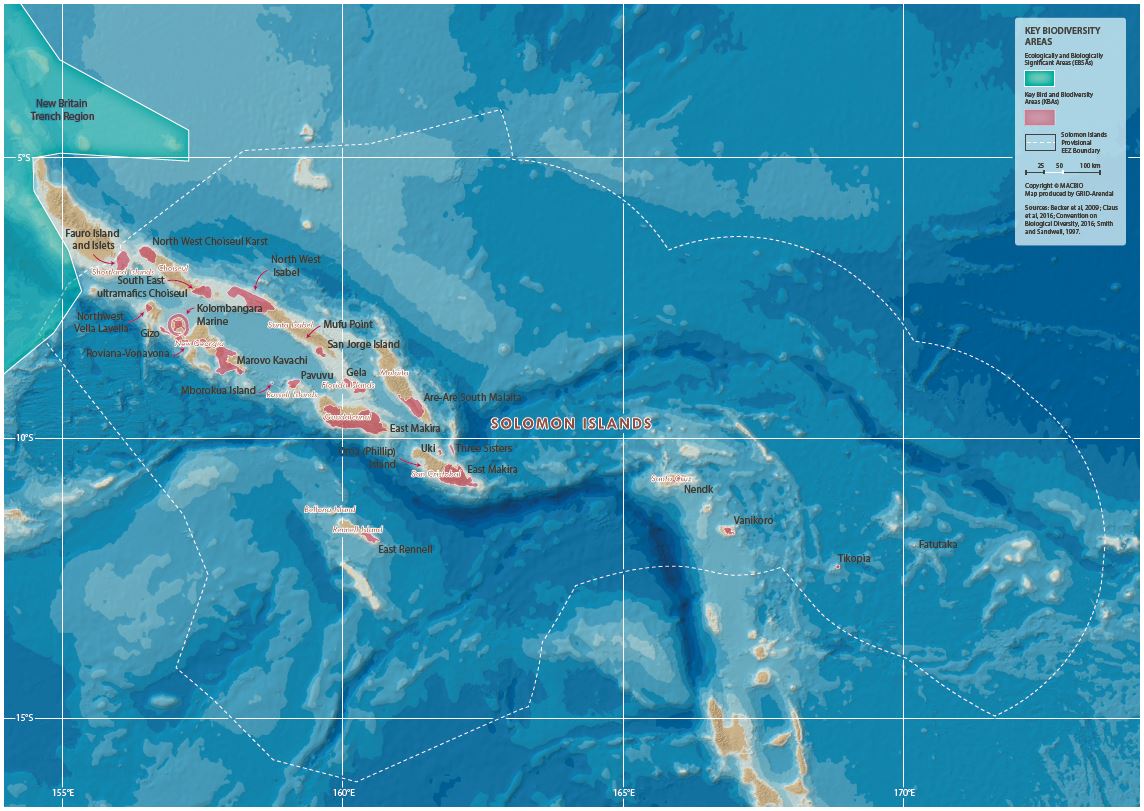
This is an example map from the Solomon Islands Marine Atlas. A series of maps from the Marine Atlas are uploaded as separate datasets to this portal. Use the search box or filter by the keyword/tag "maps".
This file is for public use as awareness
PowerPoint presentation on the building blocks and features of the environment data portals.
PowerPoint presentation with tips on good practices, when uploading data to the environment data portals.
End of SPREP internship presentation, July 2015. Sections: climate finance challenges, overview of climate finance in the Pacific, and next steps.
The Gridded Population of the World, Version 4 (GPWv4): Population Density, Revision 11 consists of estimates of human population density (number of persons per square kilometer) based on counts consistent with national censuses and population registers, for the years 2000. A proportional allocation gridding algorithm, utilizing approximately 13.5 million national and sub-national administrative units, was used to assign population counts to 30 arc-second grid cells.
The Gridded Population of the World, Version 4 (GPWv4): Population Density, Revision 11 consists of estimates of human population density (number of persons per square kilometer) based on counts consistent with national censuses and population registers, for the year 2005. A proportional allocation gridding algorithm, utilizing approximately 13.5 million national and sub-national administrative units, was used to assign population counts to 30 arc-second grid cells.