The full global assessment can be downloaded from the GCRMN website.
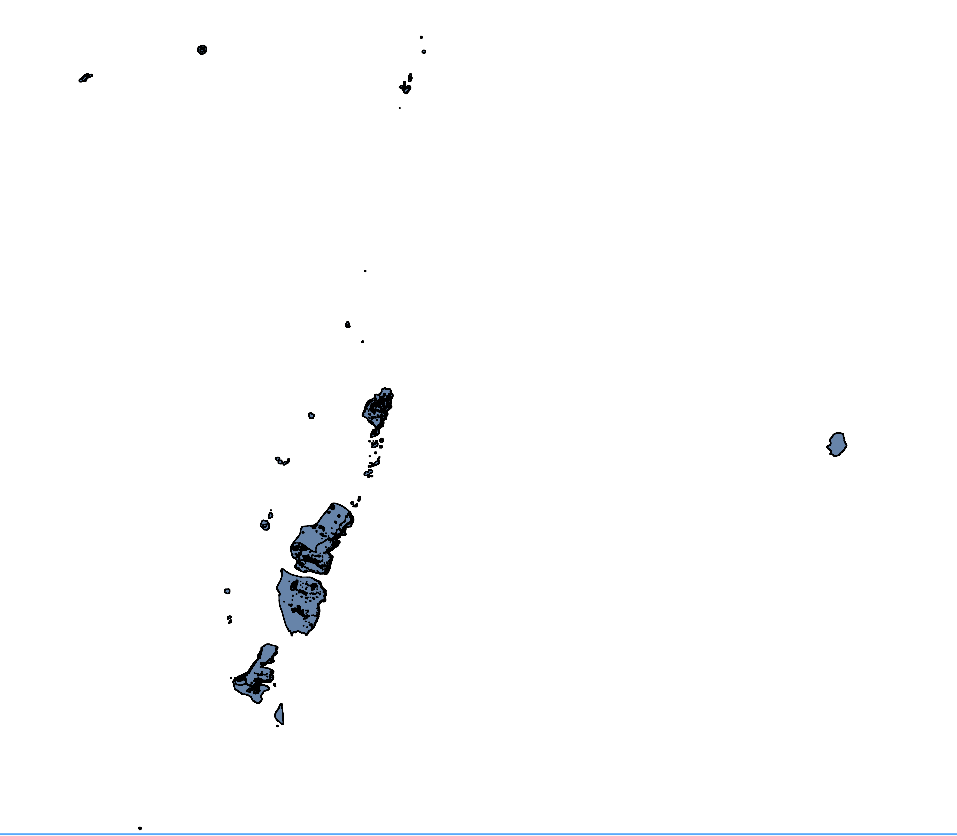
he 33 deepwater bioregions for the Solomon Islands were condensed into 26 bioregions. The major changes were made to the northwestern side of the Solomon Islands EEZ; there was general agreement about the deepwater bioregions in the southeastern half of the country. Bioregions 120, 164, 167, 192, 244, and 304 were merged with Bioregion 222. Bioregion 226 was split into two halves, and one part of the non-contiguous Bioregion 240 (the part closer to the islands) was merged with 222.
The Institute for Marine Remote Sensing (IMaRS) at the University of South Florida (USF) was funded by the Oceanography Program of the National Aeronautics and Space Administration (NASA) to provide an exhaustive worldwide inventory of coral reefs using high-resolution satellite imagery. By using a consistent dataset of high-resolution (30 meter) multispectral Landsat 7 images acquired between 1999 and 2002, USF characterized, mapped and estimated the extent of shallow coral reef ecosystems in the main coral reef provinces (Caribbean-Atlantic, Pacific, Indo-Pacific, Red Sea).
a mapping representation of active and passive continental margins, oceanic plate boundaries and mid ocean spreading ridges
Aitutaki Water Quality Results 2010 Streams
The amended Code of the Federated States of Micronesia states in section 104 that the exclusive economic zone is contiguous to the territorial sea. The inner boundary of the exclusive economic zone of each island or atoll is the seaward boundary of the territorial sea, and the outer boundary is a line, every point of which is two hundred nautical miles seaward of the nearest point on the baseline.
statistical records as of 2014 on the distribution of seamount. Accordingly, there are more seamounts in the Pacific Ocean than in the Atlantic, and their distribution can be described as comprising several elongate chains of seamounts superimposed on a more or less random background distribution (Craig and Sandwell)
The SPREP ID map is a high resolution (1MB) that shows SPREP member countries with their Exclusive Economic Zone (EEZ) boundaries developed by the GIS team at SPREP.
The SPREP ID map is low resolution (200KB) that shows SPREP member countries with their Exclusive Economic Zone (EEZ) boundaries developed by the GIS team at SPREP.
The map is high resolution showing SPREP member countries' Exclusive Economic Zone (EEZ) boundaries overlaid on a bathymetric base layer that was developed by the GIS team at SPREP.
The map is low resolution showing SPREP member countries' Exclusive Economic Zone (EEZ) boundaries overlaid on a bathymetric base layer that was developed by the GIS team at SPREP.
The WDPA User Manual provides information and guidance about the data held within the WDPA, including its history, how it is collected, managed and distributed, and how it should be interpreted and used for analyses and research. The Manual has been prepared for WDPA data providers and users. It is structured in 4 sections and includes 6 appendices.
The Protected Areas Working Group (PAWG) of the Pacific Islands Round Table for Nature Conservation recommended a forum to better connect a diverse range of people and their work relating to protected and conserved areas. To increase efficacy with respect to gaining momentum with communications and conservation work, the Pacific Islands Protected Area Portal (PIPAP) was launched.