… Map of Tuna Management Zones based on Solomon Islands Tuna Management and Development Plan. Data Baseline is The Delimitation of …
… among others vessel tracts, fisheries data, protected and restricted areas. Data sources are: … Region. KBAs: CEPF DSM Tenements: Ministry of Lands and Survey, Solomon Islands Shipping Routes: Solomon Islands Maritime and Ports Authority (SIPA) Marine Managed Areas: CTAtlas …
… of habitat suitability for seven suborders of cold water octocoral found deeper than 50m. Map is based on data … Yesson et al (2012) Global habitat suitability of cold water Octocorals, Journal of Biogeography 39, 1278-1292. … …
… Map showing the location of Turtle tag stations and migration routes. The map was developed by MACBIO as resource for the bioregions workshop in Feb 2018. Data is based on SPREP's Turtle Research and Monitoring Database System (TREDS). TREDS provides …
… In oceanography, a front is a boundary between two distinct water masses. The water masses are defined by moving in different directions. The water masses on either side of a front may also have …
… Map developed by MACBIO as resource for the bioregions workshop in Feb 2018. Nitrate is an essential resource, which, together with available light, determines … concentration is also a key variable of biogeochemical and ecosystem models. Data is based on CSIRO Atlas of …
… Map developed by MACBIO as resource for the bioregions workshop in Feb 2018. Data is …
… in Solomon Islands EEZ. Risk categories: low, medium, high and very high. Data: Reefs at Risk Revisited (2011), World Resource Institute. The Reefs at Risk project assesses the … and pollution. The map was developed by MACBIO as resource for the bioregions workshop in Feb 2018. … png … …
… in Solomon Islands EEZ. The map was created by MACBIO as resource for the workshop on bioregions in Feb 2018. Data is …
… surface in Einstein m-2 d-1. the map was developed as resource by MACBIO for the bioregions workshop in Feb 2018. …
… The map was developed by MACBIO as resource for the bioregions workshop in Feb 2018. … png … …
… This map was developed by MACBIO as resource for the bioregions workshop 2017 and shows ocean surface currents based on data from NOAA …
… Solomon Islands Oceans. The map was developed by MACBIO as resource for the bioregions workshop in Feb 2018. Data on …
… (Kd490) which is an indicator of the turbidity of the water column. The grid is derived from MODIS (Moderate … Imaging Spectoradiometer) images from NASA's Terra and Aqua satellites (http://oceancolor.gsfc.nasa.gov). … png …
… of carbon in the ocean. The map was developed by MACBIO as resource for the bioregions workshop in Feb 2018. Carbon data …
… of Ports Authority. The map was developed by MACBIO as resource for the bioregions workshop in Feb 2018. … png … …
… pollution incidents. The map was developed by MACBIO as resource for the bioregions workshop in Feb 2018. Data is …
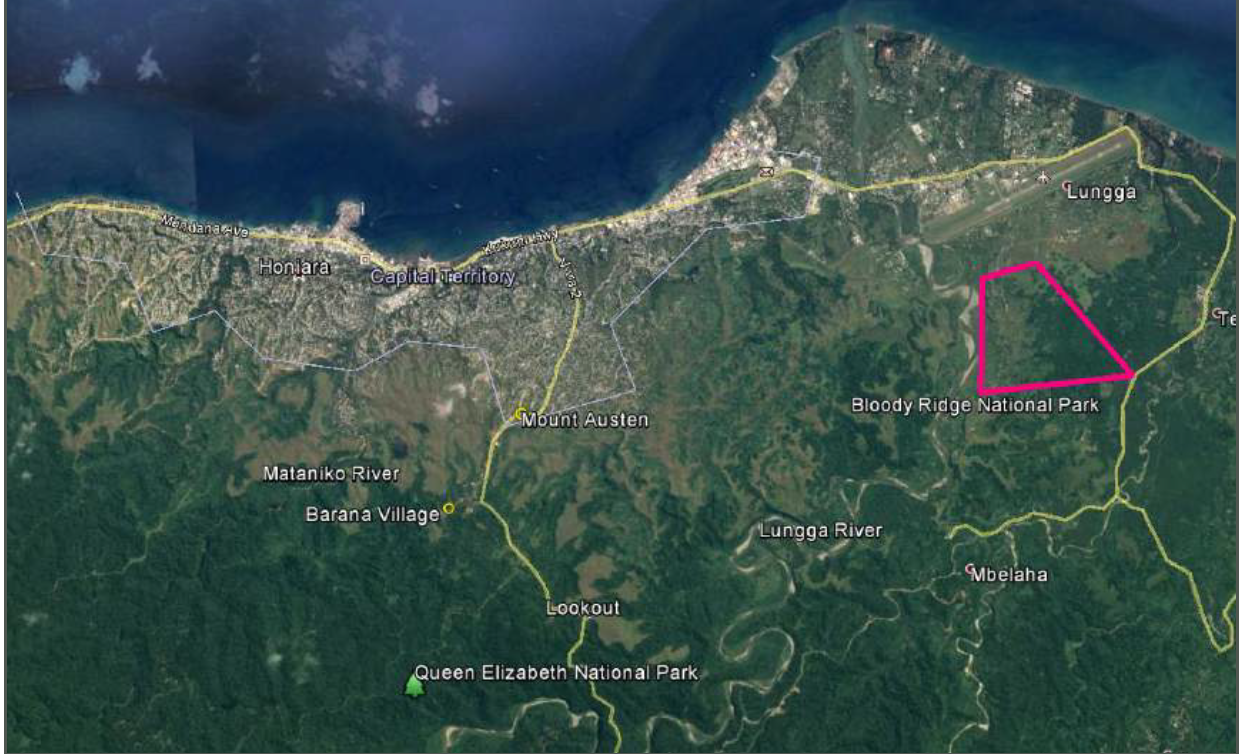
… Indication of location for the establishment of the Barana and Queen Elizabeth Park to improve the upper Mataniko and Lungga catchment area’s provision of fresh water supply and other ecosystem services. *refer to Honiara …
Capture.PNG
(1.99 MB)
… from 1950 - 2012. The map was developed by MACBIO as resource for the bioregions workshop in Feb 2018. Data is …