… in Solomon Islands EEZ. The map was created by MACBIO as resource for the workshop on bioregions in Feb 2018. Data is …
… surface in Einstein m-2 d-1. the map was developed as resource by MACBIO for the bioregions workshop in Feb 2018. …
… The map was developed by MACBIO as resource for the bioregions workshop in Feb 2018. … png … …
… (Kd490) which is an indicator of the turbidity of the water column. The grid is derived from MODIS (Moderate … Imaging Spectoradiometer) images from NASA's Terra and Aqua satellites (http://oceancolor.gsfc.nasa.gov). … png …
… This map was developed by MACBIO as resource for the bioregions workshop 2017 and shows ocean surface currents based on data from NOAA …
… Solomon Islands Oceans. The map was developed by MACBIO as resource for the bioregions workshop in Feb 2018. Data on …
… Buffer distances of 100, 150 and 250km created from the volcanic eruption boundary to …
… of carbon in the ocean. The map was developed by MACBIO as resource for the bioregions workshop in Feb 2018. Carbon data …
… of Ports Authority. The map was developed by MACBIO as resource for the bioregions workshop in Feb 2018. … png … …
… pollution incidents. The map was developed by MACBIO as resource for the bioregions workshop in Feb 2018. Data is …
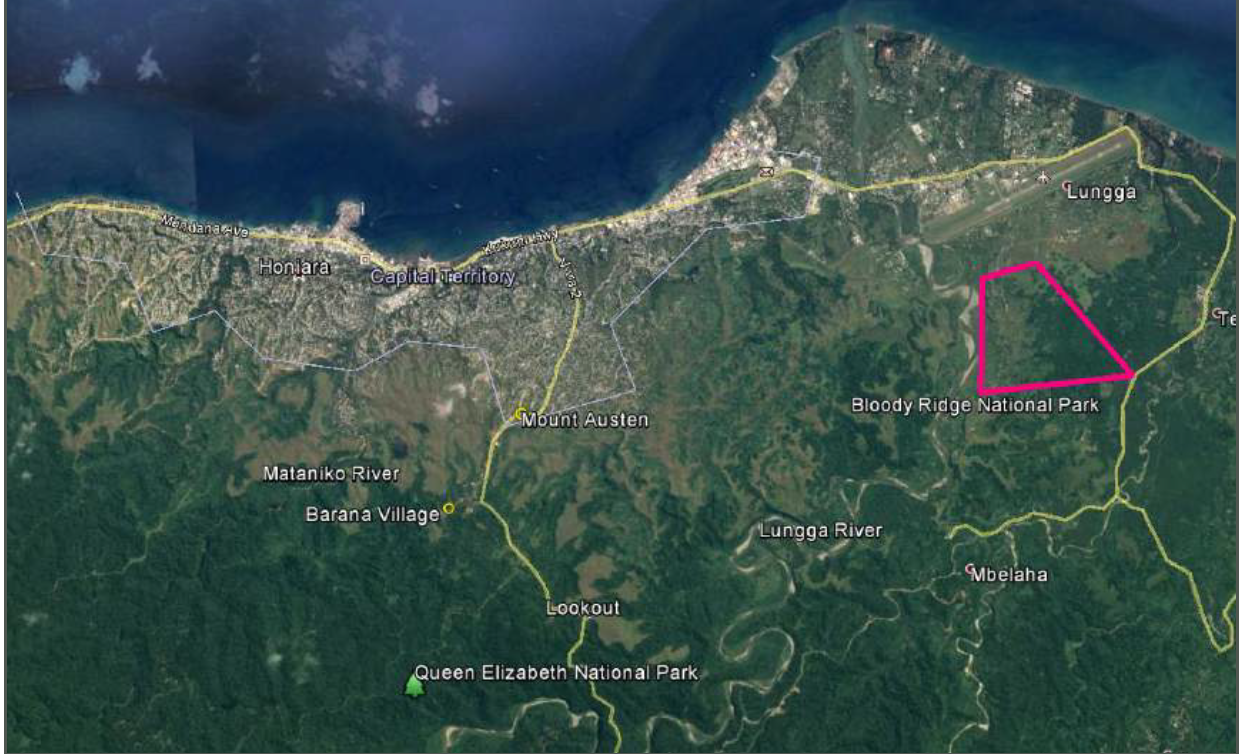
… Indication of location for the establishment of the Barana and Queen Elizabeth Park to improve the upper Mataniko and Lungga catchment area’s provision of fresh water supply and other ecosystem services. *refer to Honiara …
Capture.PNG
(1.99 MB)
… from 1950 - 2012. The map was developed by MACBIO as resource for the bioregions workshop in Feb 2018. Data is …
… Map showing tuna catch in metric tonnes using the "Pole and Line" method from 1950-2012. The map was developed by MACBIO as resource for the bioregions workshop in Feb 2018. Data is …
… This resource contains satellite imagery for Yap. The imagery was collected on April 12, 2019. More specially, this resource contains a raster file of RGB imagery at 10-meter … Level-2A products include atmospheric correction and represent bottom of atmosphere reflectance values in the …
FSM_2019_ImageryYap_Sentinel2.zip
(110.51 MB)
… This resource contains satellite imagery for Nauru. The imagery was collected on May 9, 2020. More specially, this resource contains a raster file of RGB imagery at 10-meter … Level-2A products include atmospheric correction and represent bottom of atmosphere reflectance values in the …
Pacific Data Hub
… economic zone, including fishing, mining, oil exploration, and any pollution of those resources. However, it cannot … the surface of the sea that is in compliance with the laws and regulations adopted by the coastal State in accordance … eez … nr … nauru … nauru exclusive economic zone … Coastal and Marine … Coastal and Marine … Land … Biodiversity …
… This resource contains satellite imagery for Kosrae. The imagery … was collected on November 12, 2016. More specially, this resource contains a raster file of RGB imagery at 10-meter … Level-2A products include atmospheric correction and represent bottom of atmosphere reflectance values in the …
… This resource contains satellite imagery for Bikini Island. The … was collected on January 28, 2020. More specially, this resource contains a raster file of RGB imagery at 10-meter … Level-2A products include atmospheric correction and represent bottom of atmosphere reflectance values in the …
MHL_2020_BikiniImagery_Sentinel2.zip
(0 bytes)
… This resource contains satellite imagery for Bikar Atoll in the … was collected on April 11, 2020. More specially, this resource contains a raster file of RGB imagery at 10-meter … Level-2A products include atmospheric correction and represent bottom of atmosphere reflectance values in the …
MHL_2020_ImageryBikar_Sentinel2.zip
(0 bytes)
… This resource contains satellite imagery for Ebon Atoll in the … was collected on February 16, 2020. More specially, this resource contains a raster file of RGB imagery at 10-meter … Level-2A products include atmospheric correction and represent bottom of atmosphere reflectance values in the …
MHL_2020_ImageryEbon_Sentinel2.tif_.zip
(0 bytes)