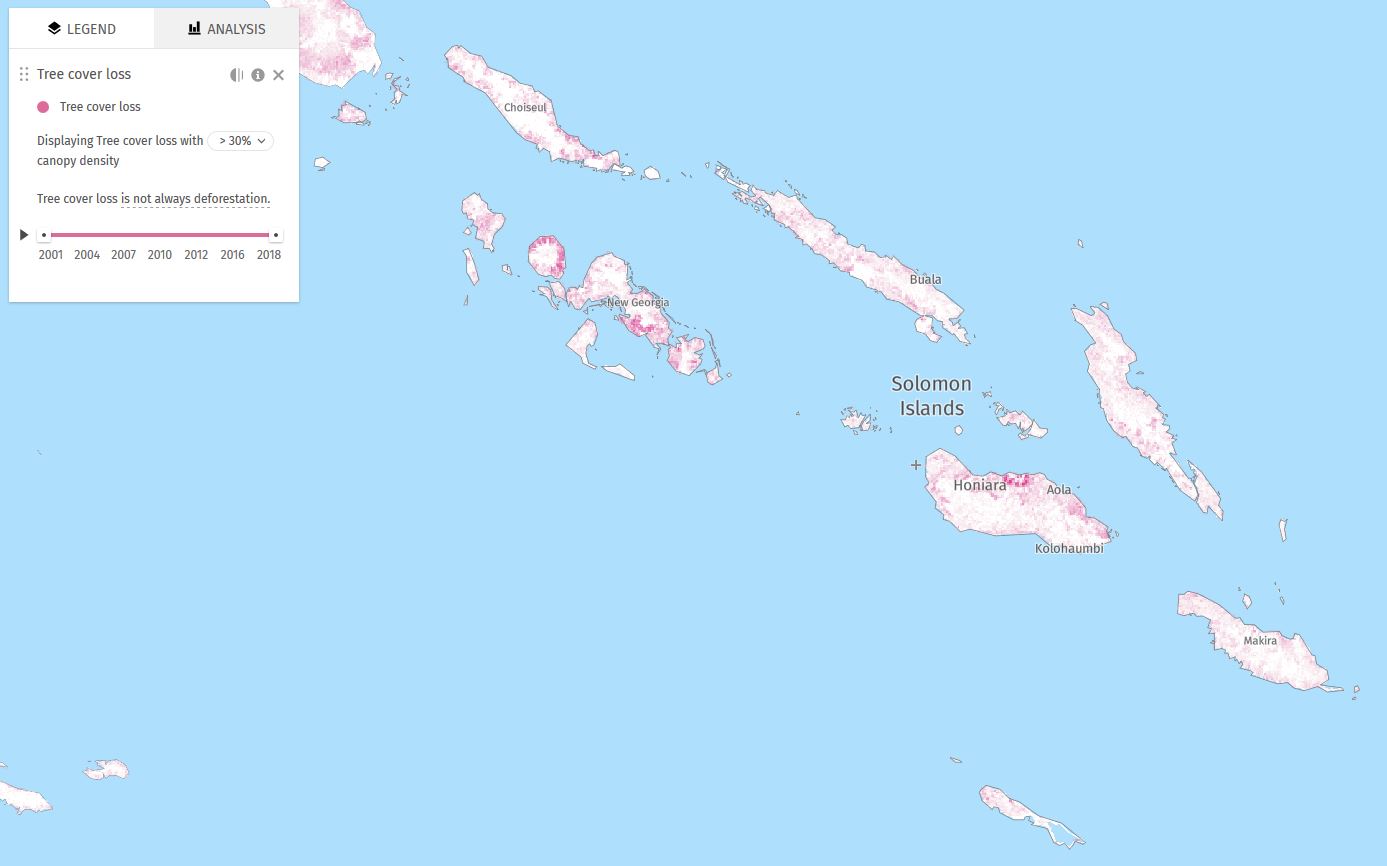
Map displaying tree cover loss with > 30% canopy density, between 2001-2018. Tree cover loss is not always deforestation. Global Forest Watch data.
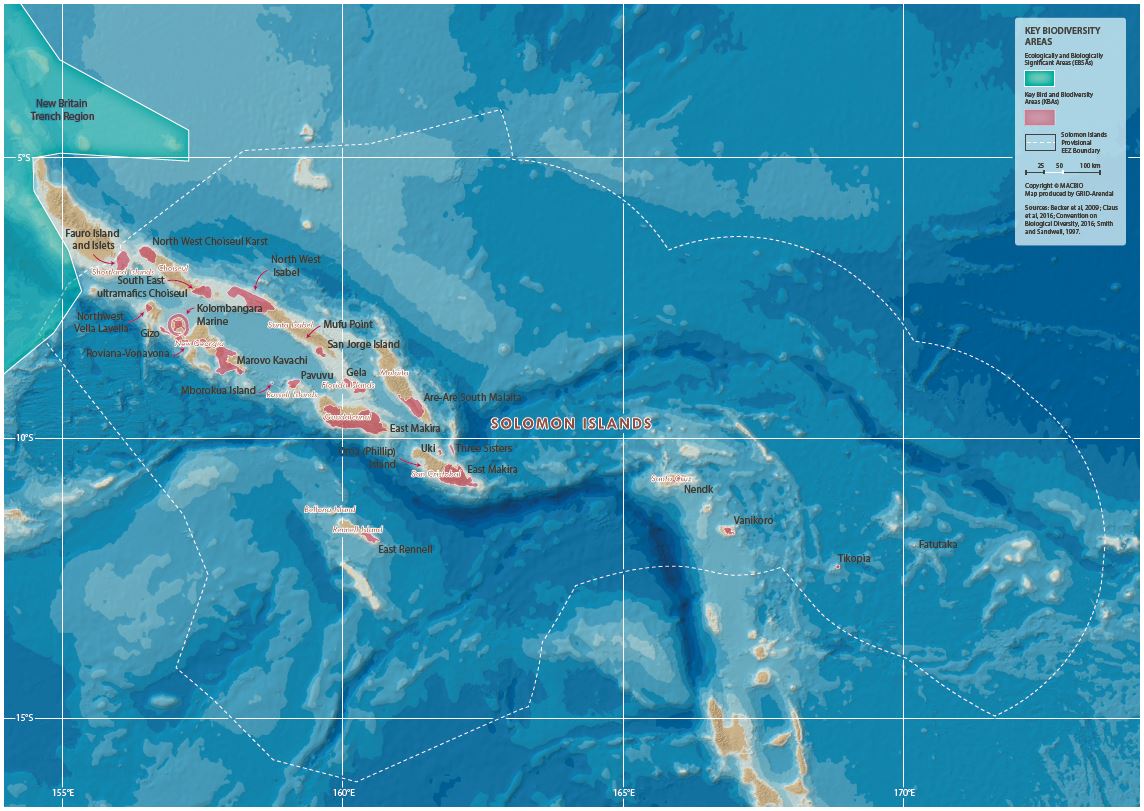
This is an example map from the Solomon Islands Marine Atlas. A series of maps from the Marine Atlas are uploaded as separate datasets to this portal. Use the search box or filter by the keyword/tag "maps".
This shapefile shows the global 12 nautical miles zone. It can be opened in QGIS and Google Earth.
This is a shapefile layer that shows the global EEZ. It can be opened in any GIS software.
The maps highlights areas with significant shift in the shoreline by overlaying shoreline data from Nov 2021 and January 2022
The maps highlights areas with significant shift in the shoreline by overlaying shoreline data from Nov 2021 and January 2022
This is a test for upload invasive species document
Rarotonga Water intakes and Streams
steams and water intakes rarotonga 2014 or older
Map of the protected areas for Northern Islands, Cook Islands with country-level summary statistics on the amount of area under protection, count for each type of protected area (terrestrial or marine), and the count of their designation.